We are continuing our series of articles on the features of connecting different types of data sources in Stimulsoft products. In the previous article, we discussed connecting JSON data, and today we will take a look at the Excel data source.
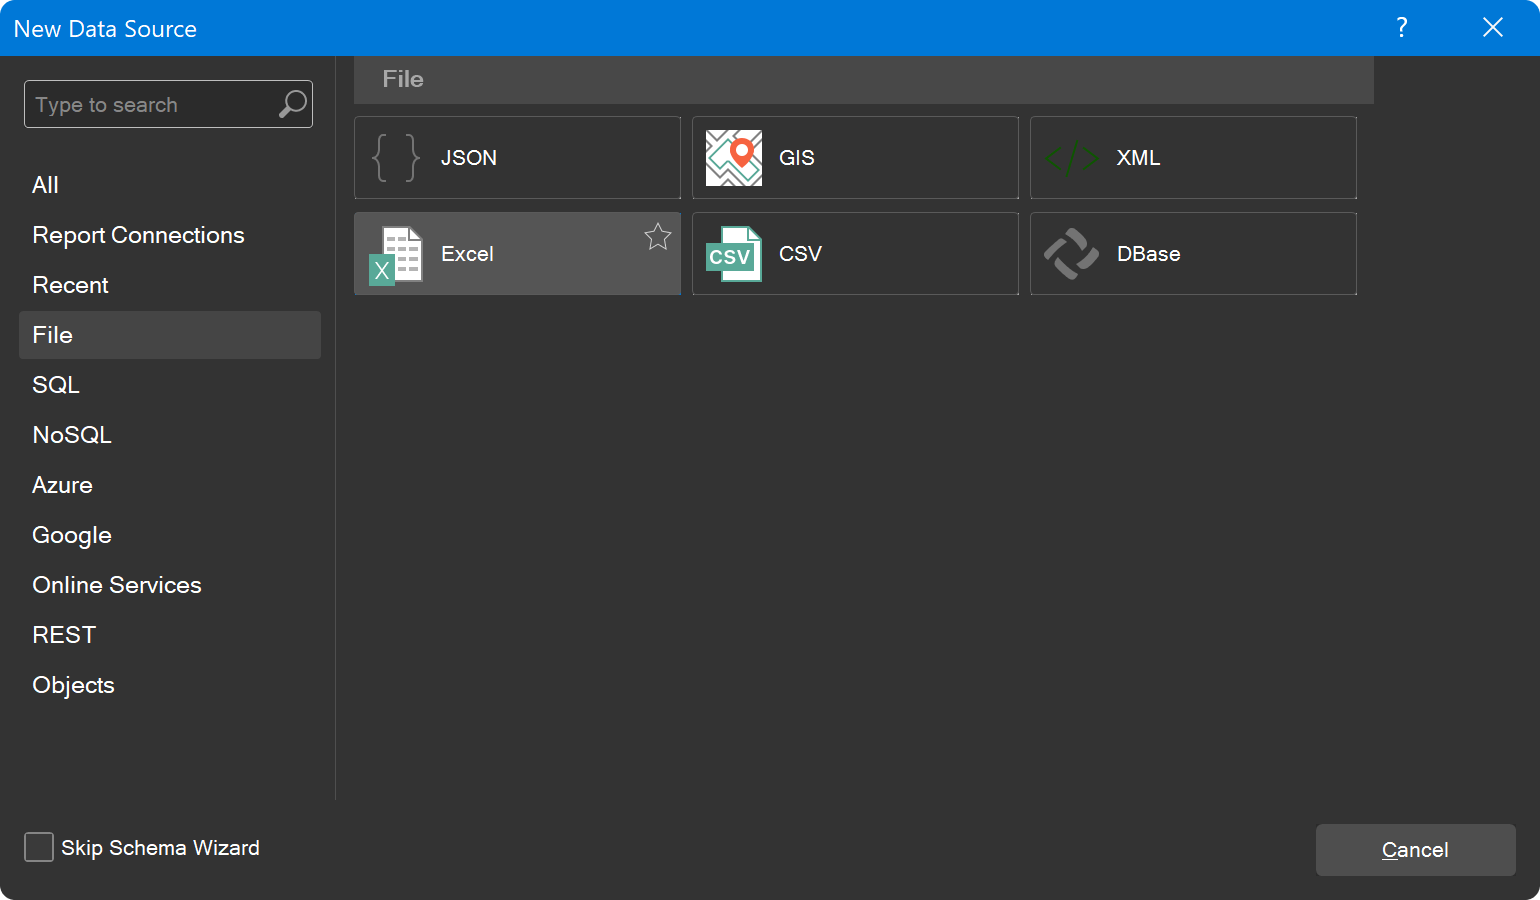
Next, in the pop-up window, go to the File tab and select Excel.
After this, you should click the OK button. To edit the data source, you need to select it in the dictionary and execute the Edit command.
Now the selected Excel data source can be used in your report or dashboard.
Creating a data source
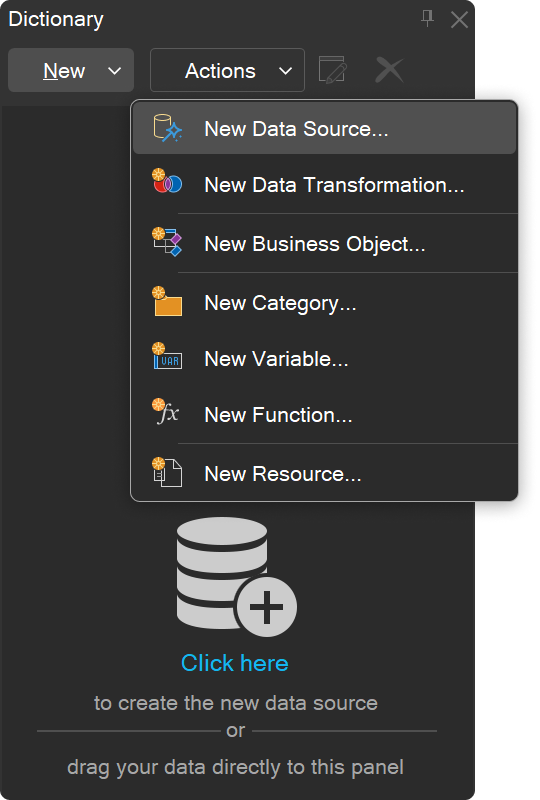
To connect data sources in the designer, navigate to the Data Dictionary tab, click the New button, and select New Data Source.Next, in the pop-up window, go to the File tab and select Excel.
Data source settings
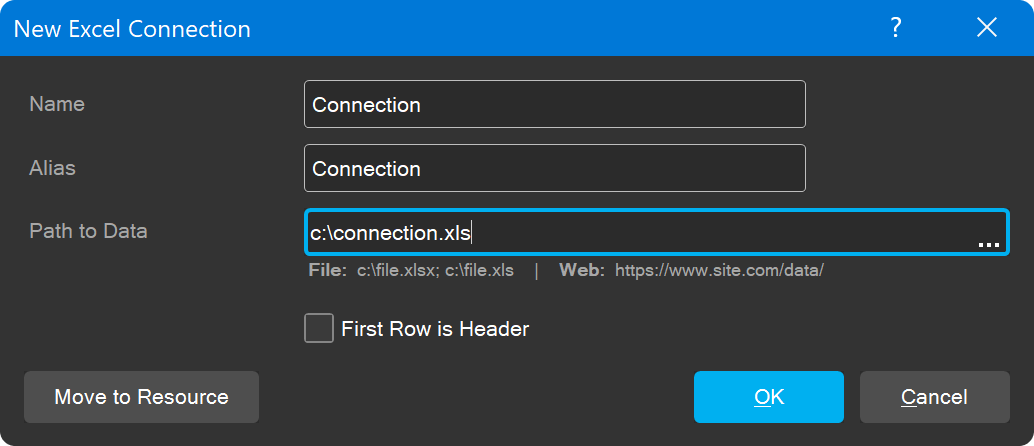
Configure the connection by defining a name and alias, specifying the path to the Excel data source, and deciding whether the first row of the table will be used as a header. Note that the path can be either to an Excel file or a URL. If you specify a path to a file with the *.xls extension, you should add LibExcel.dll to the project. Alternatively, you can embed the data directly in the report by using the Move to resource button.After this, you should click the OK button. To edit the data source, you need to select it in the dictionary and execute the Edit command.
Data selection
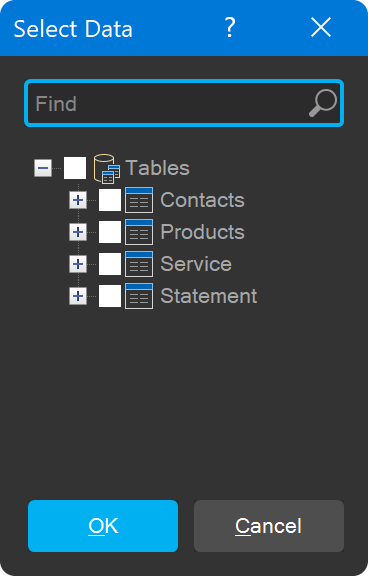
The next step is to select the data tables you want to use in the report or dashboard. To do this, mark the desired elements in the list and click the OK button in the Data Select window.Now the selected Excel data source can be used in your report or dashboard.
Still have questions? If you do, please feel free to contact us.