


Stimulsoft Dashboards.WIN
Creating dashboards in Windows applications
Stimulsoft Dashboards.WIN is a comprehensive tool designed for processing, analyzing, grouping, filtering, sorting, and displaying data on dashboards. The software is fully compatible with the .NET Framework 4.5.2 and higher, and it can be effortlessly integrated into both WinForms and WPF applications. Additionally, the product offers a wide range of advanced data visualization features.Types of Dashboards
Stimulsoft Dashboards.WIN allows you to create a variety of analytical panels, including KPI and HR dashboards, sales and insurance dashboards, statistical and marketing panels. You can start quickly by exploring a range of professional examples available in the Demo cloud service and within the designer.


Creating dashboards
The dashboard designer is the cornerstone tool of our product. It is a powerful editor that enables users to create custom dashboard layouts. With the designer, you can connect to various data sources, including SQL databases like MS SQL, MySQL, Firebird, MS Access, as well as cloud-based platforms such as MongoDB, Azure, and Google. Additionally, you can work with file sources, such as JSON, Excel, XML, and many more. After connecting to the data sources, you can structure and manipulate the data by grouping and sorting it, and then apply a range of visual styles to create dynamic and informative dashboards. Once you are satisfied with the dashboard design, you can publish the analytical panel to your application.
It's important to note that the Dashboard Designer component is licensed royalty-free, which means that users can create dashboards without incurring additional deductions.

AI functionality in the report designer
The report designer includes AI functionality to assist with various stages of report creation. The Stimul AI assistant is integrated into many elements, such as events, variables, conditions, and more. It can verify and correct connection strings for SQL data sources, check event script code, convert scripts written in Blockly to code, validate expressions, and much more.Learn more about the Stimul AI assistant here.
Steps to use BI Dashboards
Our data presentation and analytics tools provide a comprehensive solution for creating clear and visually engaging dashboards with numerous metrics and analysis elements.


1
Connect data from databases, online services, file data sources.
2
Prepare data for analysis - we select the necessary data, link them together, structure them.
3
Present data, group it, sort and filter, choose metrics for visualization.


4
Create a dashboard layout, apply styles to design the dashboard.
5
Test the dashboard in the viewer, prepare it for publication in the application using the publishing wizard.
6
Publish the finished dashboard, use it in our WinForms or WPF application.
1
Connect data from databases, online services, file data sources.
2
Prepare data for analysis - we select the necessary data, link them together, structure them.
3
Present data, group it, sort and filter, choose metrics for visualization.
4
Create a dashboard layout, apply styles to design the dashboard.
5
Test the dashboard in the viewer, prepare it for publication in the application using the publishing wizard.
6
Publish the finished dashboard, use it in our WinForms or WPF application.
Dashboard visualization
The viewer is a crucial component of our Stimulsoft Dashboards.WIN product, providing users with an efficient and flexible way to analyze, filter, and sort data on their dashboard. With our embeddable dashboard viewer component, you can offer your users a highly customizable data analysis tool that can help them make informed business decisions. One of the key advantages of our dashboard viewer is its integration into any applications and services developed on the WinForms and WPF platforms.
Export dashboards
Stimulsoft products offer a range of interactive features that allow users to engage with visual elements in dynamic and engaging ways. For example, you can capture the current state of a dashboard at any time using the dashboard snapshot feature. This feature allows you to save the results of your analysis and continue working with them in the designer, just like any other template. In addition, our products enable you to save your dashboard in various formats, including HTML, Excel, PDF, SVG, and more.
Data for dashboards
One of the key advantages of our product is the diversity of data you can use for creating dashboards in your application. We offer a large list of supported data servers – MS SQL, Firebird, MySQL, PostgreSQL, etc. Also, you can get data from XML, JSON, Excel, and other file sources.Integration
Our data analytics and visualization product Stimulsoft Dashboards.WIN is designed for integration into WinForms and WPF applications. You can control all stages of dashboard work, from data loading and connection to viewing and printing of the final document. In addition to a wide range of visual components, any actions can be performed using server-side code. WPF
WPF WinForms
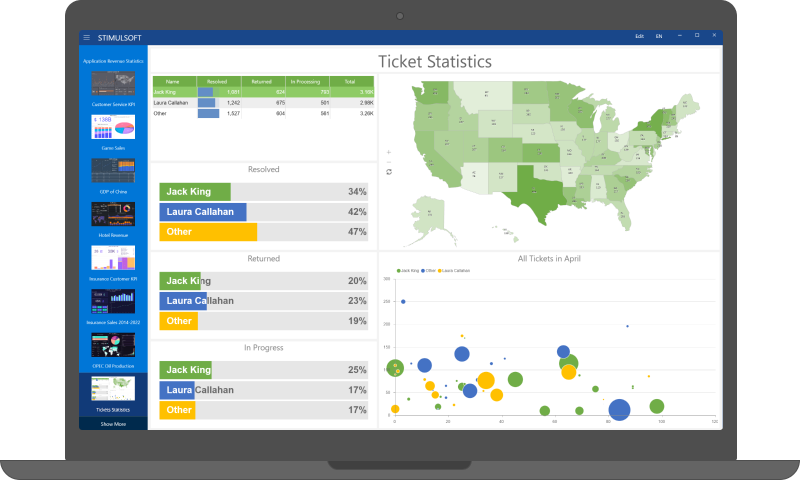
Stimulsoft WPF Demo
Stimulsoft Demo.WPF is a demo application for exploring the functionality and benefits of a reporting tool and dashboard panels. It contains lots of specific reports and dashboards designed by us. We grouped them by categories and features.
Stimulsoft Ultimate
Stimulsoft Dashboards.WIN is part of Stimulsoft Ultimate, a comprehensive All-in-One set of products designed for working with data on all modern platforms such as .NET, ASP.NET, JavaScript, Java, PHP, Blazor, Angular, WPF, WinForms, Avalonia UI, Python, and others. With our components, you can create, print, export complex reports, analyze data using clear and colorful dashboards, and collect data from users through interactive forms.What's next?
We have prepared hundreds of reports and dashboards templates grouped by spheres of use. You can immediately use them by connecting your data or change according to your requirements. Our lessons and technical documentation will help make your work effective! Moreover, you can request the training courses from our technical specialists, subscribe to our YouTube channel to always get new videos, and receive all your answers in our online documentation.
Training courses
Are you faced with difficulties when creating reports and dashboards? This is not a problem!
Video lessons
We have prepared many video materials for the designing reports and dashboards. All tutorials are grouped by specific topics and regularly updated and supplemented.
Documentation
Our online user guides describe both the general functionality of the product and provide advice and suggestions for the report design and hints of setting components for reporting.