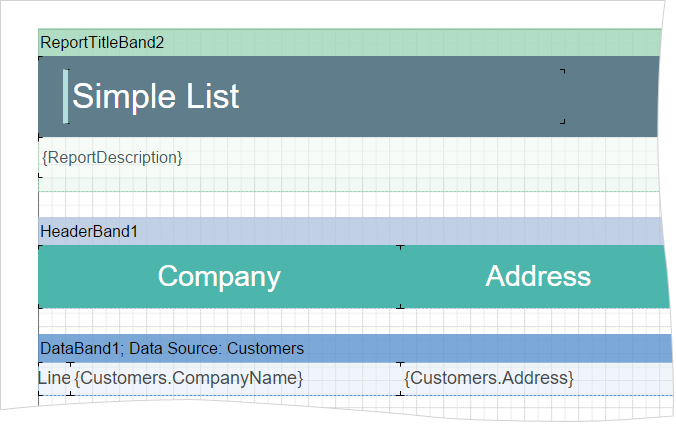
We have added the ability to display a grid on the page in HTML5 and JS designers. The grid is used for accurate alignment of the components relative to each other. For example, you can use the Snap to Grid command to bind the components of the report to the grid nodes. Drawing grid can be done with dots and lines. Enabling Grid and defining how it looks like can be done in the Options window.
UltimateSupported platforms are WinForms, WPF, ASP.NET (MVC, WebForms), .NET Core (MVC, Razor), Blazor (Server, Wasm), JavaScript, Node.js, Angular, PHP, Python, Java, Avalonia, and various frameworks built on these platforms. This kit includes all embedded solutions of reports, dashboards and forms. |
Reports.WEBASP.NET, MVC, .NET Core, Angular, Blazor |
Reports.NETWinForms, .NET Core, .NET, .NET Framework |
Reports.JSJavaScript, Node.js, Angular, React, Vue.js |
Reports.WPFWPF, .NET Framework, .NET Core, .NET |
Reports.PHPPHP 5, PHP 7, PHP 8 |
Reports.BLAZORBlazor Server, Blazor Wasm |
Reports.ANGULARAll actively supported versions |
Reports.AVALONIA.NET 6+ |
Reports.PYTHONPython 3.10+, JavaScript |
Reports.JAVAJava™ SE 1.8+ |
Dashboards.WEBASP.NET, MVC, Blazor, .NET Core, .NET |
Dashboards.WINWinForms, WPF, .NET Core, .NET, .NET Framework |
Dashboards.JSJavaScript, Node.js, Angular, React, Vue.js |
Dashboards.PHPPHP 5, PHP 7, PHP 8 |
Dashboards.BLAZORBlazor Server, Blazor Wasm |
Dashboards.ANGULARAll actively supported versions |
Dashboards.PYTHONPython 3.10+, JavaScript |
BI CloudA cloud service to quickly and efficiently analyze and visualize data for your business without creating your applications and programming. |
BI DesignerA sturdy product that runs on any computer and any platform. |
BI ServerA complete set of tools for working with reports and dashboards, as well as user management and automation tools. |