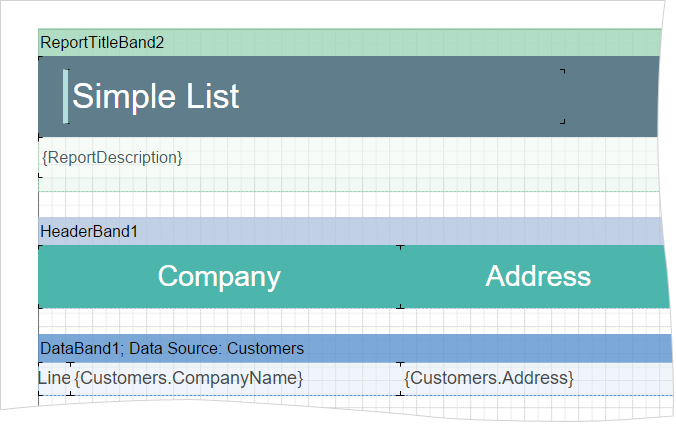
We have added the ability to display a grid on the page in HTML5 and JS designers. The grid is used for accurate alignment of the components relative to each other. For example, you can use the Snap to Grid command to bind the components of the report to the grid nodes. Drawing grid can be done with dots and lines. Enabling Grid and defining how it looks like can be done in the Options window.
UltimateDie Plattformen WinForms, WPF, ASP.NET (MVC, WebForms), .NET Core (MVC, Razor), Blazor (Server, Wasm), JavaScript, Node.js, Angular, PHP, Python, Java, Avalonia und verschiedene auf diesen Plattformen erstellten Frameworks werden unterstützt. Der Satz umfasst alle eingebetteten Lösungen für Berichte, Dashboards und Formulare. |
Reports.WEBASP.NET, MVC, .NET Core, Angular, Blazor |
Reports.NETWinForms, .NET Core, .NET, .NET Framework |
Reports.JSJavaScript, Node.js, Angular, React, Vue.js |
Reports.WPFWPF, .NET Framework, .NET Core, .NET |
Reports.PHPPHP 5, PHP 7, PHP 8 |
Reports.BLAZORBlazor Server, Blazor Wasm |
Reports.ANGULARAlle aktiv unterstützenden Versionen |
Reports.AVALONIA.NET 6+ |
Reports.PYTHONPython 3.10+, JavaScript |
Reports.JAVAJava™ SE 1.8+ |
Dashboards.WEBASP.NET, MVC, Blazor, .NET Core, .NET |
Dashboards.WINWinForms, WPF, .NET Core, .NET, .NET Framework |
Dashboards.JSJavaScript, Node.js, Angular, React, Vue.js |
Dashboards.PHPPHP 5, PHP 7, PHP 8 |
Dashboards.BLAZORBlazor Server, Blazor Wasm |
Dashboards.ANGULARAlle aktiv unterstützenden Versionen |
Dashboards.PYTHONPython 3.10+, JavaScript |
BI CloudCloud-Dienstleistung für schnelle und effektive Analyse und Visualisierung von Daten für Ihr Business ohne eigene Applikationen zu erstellen oder zu programmieren. |
BI DesignerPerfekte Lösung für Erstellen von Berichten und Dashboards auf dem Desktop. |
BI ServerVollständiger Client-Server-Komplex für Business Intelligence, der allen Benutzern die Möglichkeit anbietet, mit Berichten zu arbeiten und die Daten zu analysieren. |