We are proud to present the release of a new version of Stimulsoft products for creating reports, dashboards, and PDF forms! Version 2025.3 is packed with improvements and innovations, including support for scripts in Interpretation mode, the ability to launch Stimulsoft Server in a Docker container, an extended print window, and much more. Read more about these and other new features below.
A list of the new features in version 2025.3
Scripts in Interpretation Mode
In version 2025.3, the reporting tools for the .NET and .NET Framework platforms now support executing CSharp scripts in report calculation mode using Interpretation. Within script descriptions, you can use report variables, data columns, functions (including user-defined functions), as well as basic CSharp constructs such as if, else, the ternary operator, and cycles. Scripts can be executed in events, user-defined functions, and report expressions. Script execution can be disabled using the Allow Scripts To Run report property. Additionally, you can set a script timeout using the Script Timeout property. For embedded Stimulsoft components, a global option StiOptions.Engine.AllowScriptsToRun is available to enable or disable script execution in Interpretation mode.Scripts in Expression
In this release, we have added the ability to execute CSharp scripts in expressions for report components, variables, and calculated columns. If an expression contains the return operator, the report engine will process it as a script; otherwise, it will treat it as a regular expression. You can disable script execution in expressions using the Allow Scripts In Expressions report property. Please note that script execution in expressions also depends on the global Allow Scripts To Run property.
Stimulsoft BI Server in Docker
Starting with this release, you can run Stimulsoft Server in a Docker container. To install and launch Stimulsoft Server, simply use the provided Docker image. All necessary parameters - such as database type, connection string, and ports - can be specified as Docker container environment variables. The Stimulsoft Server Docker image is built on ASP.NET Core 8.0 and supports all major operating systems, including Windows, macOS, and Linux.Open Street Map
A new provider has been added for the Online Map dashboard element - OpenStreetMap. This is a full-featured provider that supports icon, bubble, value, chart, and heat map modes. Due to Microsoft’s restrictions, the Bing Search API will be disabled on August 11, 2025, and will no longer be available to new users. Bing Maps will only be usable if you have your own API key, which can be specified in the dashboard element properties. Learn more about Microsoft Bing restrictions here. Starting with version 2025.3.1, OpenStreetMap will become the default provider for online maps in Stimulsoft Dashboards.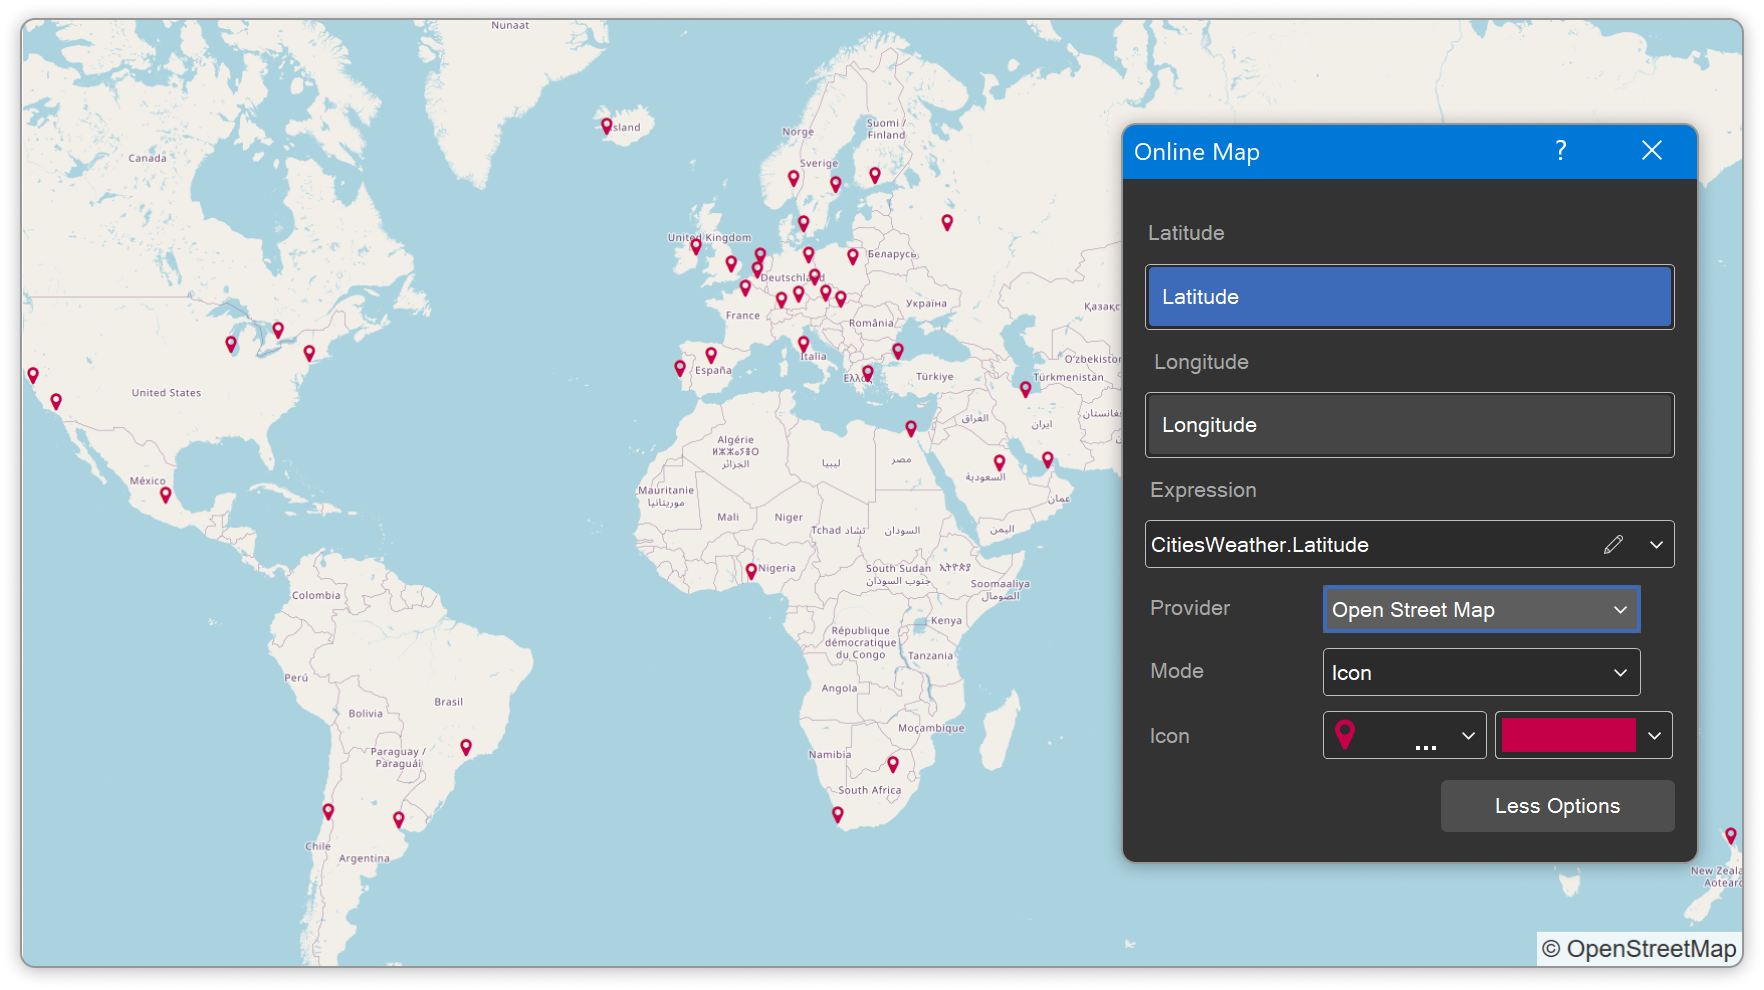
Extended Print Dialog
Our developers have added a custom print window with report preview capability to the WinForms Stimulsoft Designer for desktop and the WPF V2 report designer. The available print parameters and settings depend on the printer driver installed on the OS. To enable the custom print window, set the Printer Settings.Print Dialog Type report property to Extended.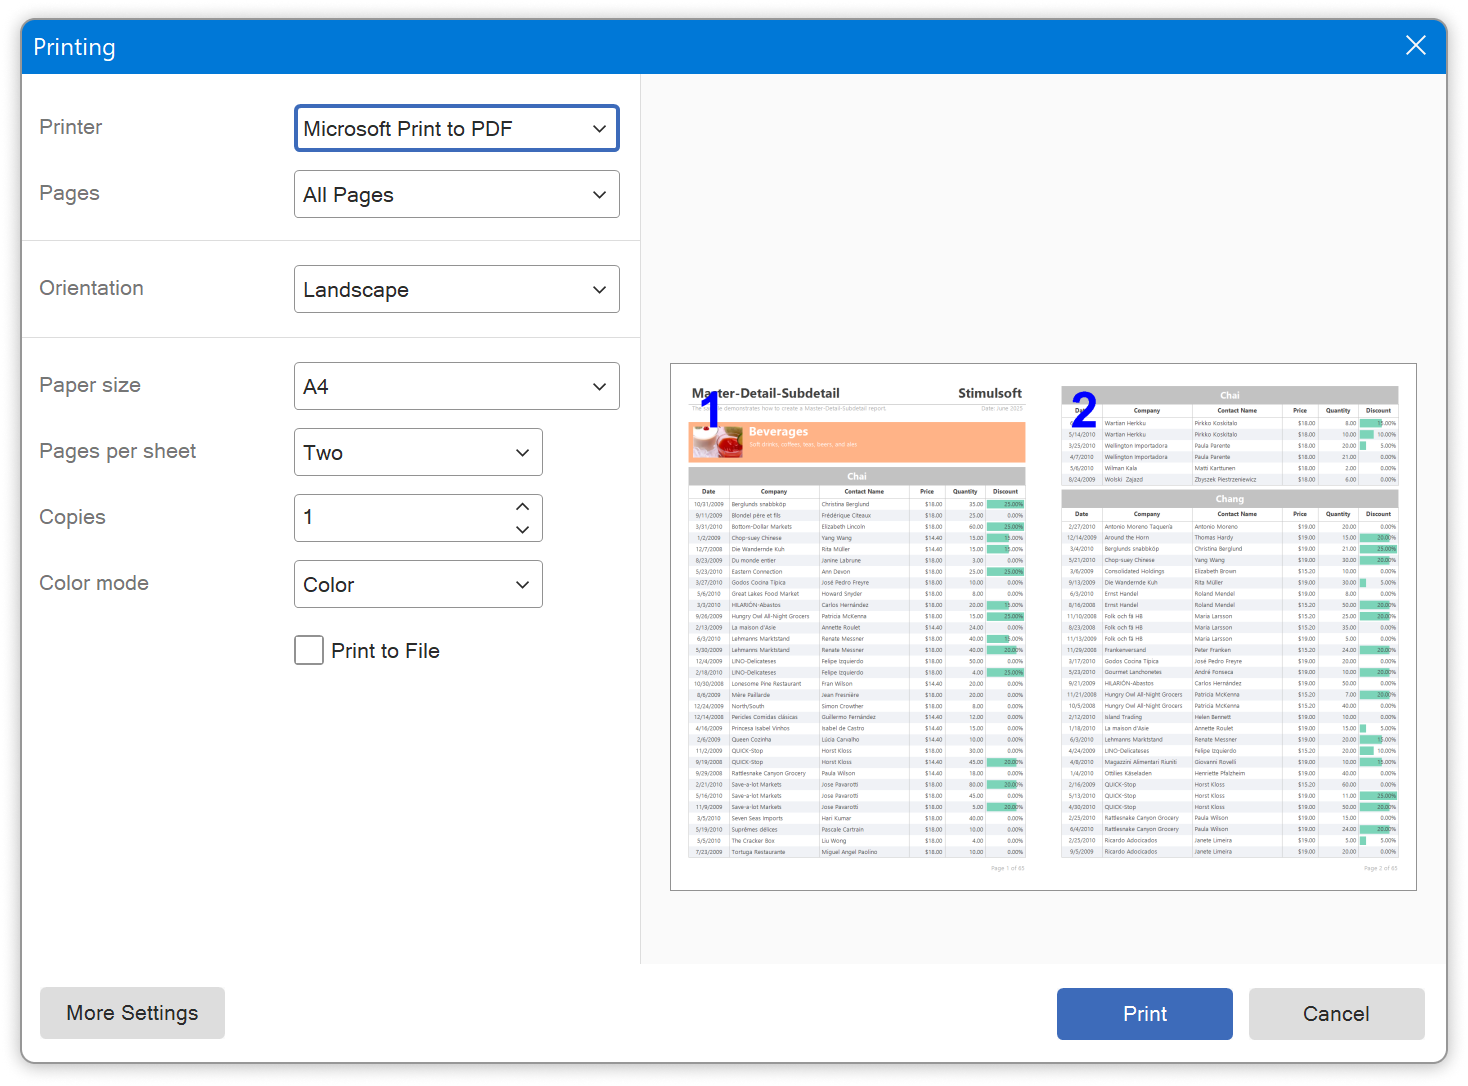
AI Data Generating
In the WinForms Stimulsoft Designer for desktop, you can now generate data using Stimul AI. To do this, go to the File > New > Get Data, click Generate Data with AI, and then enter a prompt request or select one from the samples. This feature is available only if the Show Stimul AI option is enabled in the report designer settings; otherwise, demo data will be loaded from a file.Wizards Improved with AI
The WinForms Stimulsoft BI Designer for desktop now offers the ability to simplify the report creation process using Stimul AI when dragging a data source onto the report page. In this case, the AI will analyze the data source, select the necessary columns, determine their order, apply text formatting to report components, and align them with the grid nodes on the report page. To use AI during this process, click the Suggest with AI button in the Data dialog. This feature is available only if the Show ‘Stimul AI’ option is enabled in the report designer settings.Value Type for Indicator and Progress
You can now change the type of value displayed for the Progress and Indicator dashboard elements. The Progress element can display Value, Percentage, or Value/Target. The Indicator element can display either Value or Value/Target. You can configure the displayed value using the Value Type property.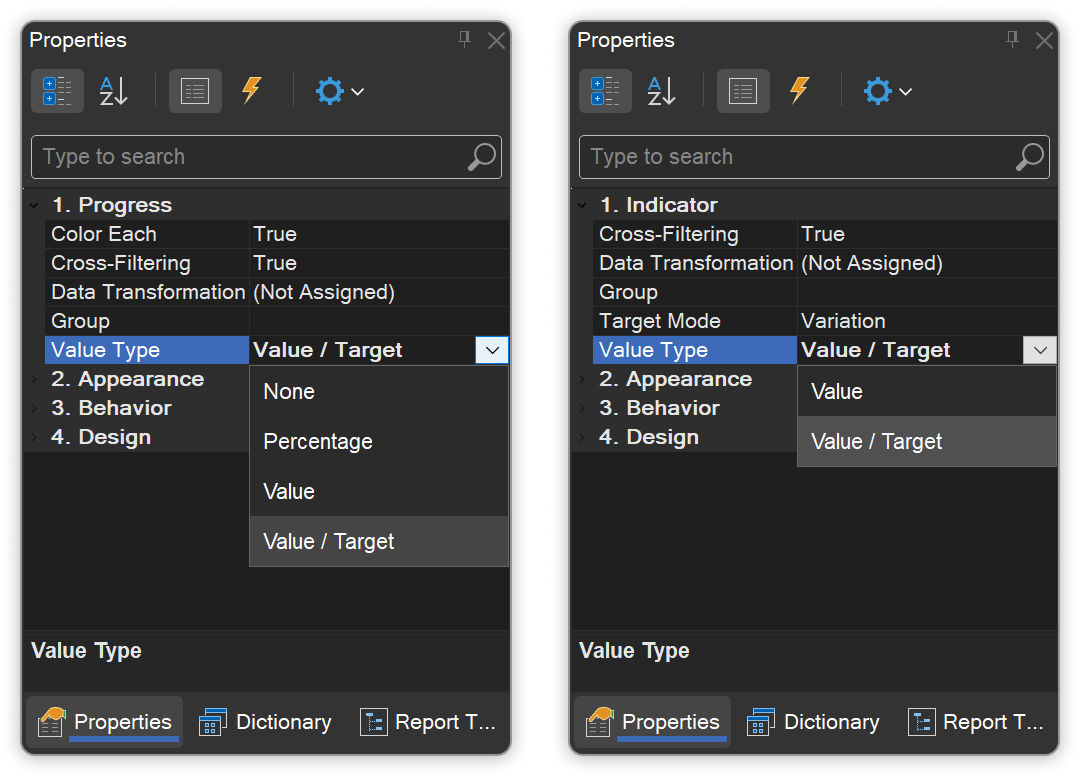

Export Cache in JS
Release 2025.3.1 includes support for caching when exporting reports to Word, Excel, and HTML table files. Caching is controlled via the reportCacheMode property. When caching is enabled, the report reduces memory consumption by storing data on the file system for Node.js or as an array of strings in memory for web browsers. Export performance may be a bit reduced due to additional read/write operations involved with caching.Chart Multi Tooltip
Dashboard charts now display all matching values in the tooltip when hovering in Stimulsoft BI Designer for Windows. Previously, if multiple data points had the same value, only the last one would appear in the tooltip. Now, all matching values are shown, providing a more complete view of the data.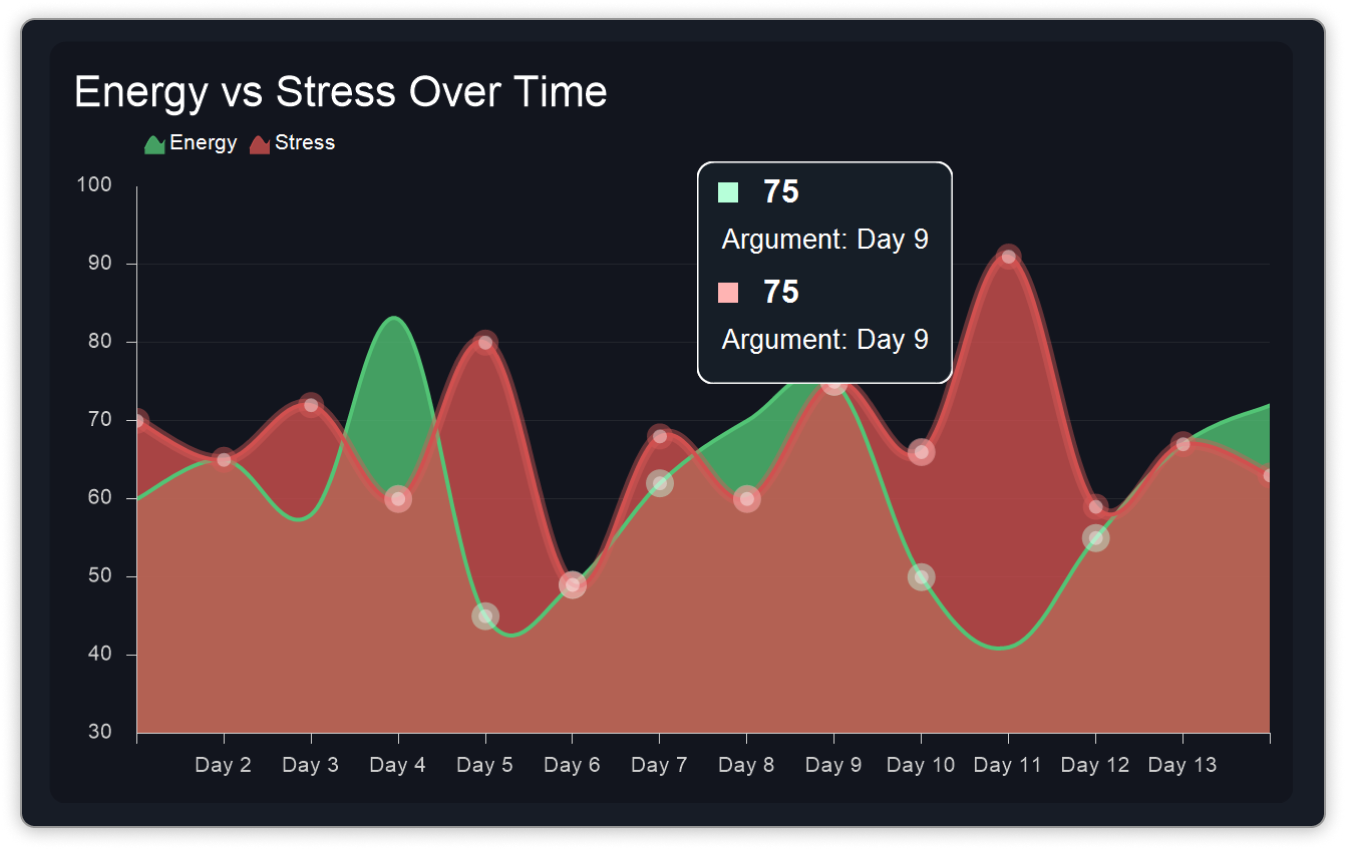
Data Join Type for Dashboards and Data Transformation
Another new feature is the ability to select the type of join between two data tables when rendering dashboards and performing data transformations. The join type defines how records from the tables are compared and merged to form the final dataset. This directly affects the structure of the resulting data, the behavior of groupings, and the outcomes of subsequent calculations. Supported join types include Full, Inner, Left, and Right. You can set the join type for data tables in the relationship editor.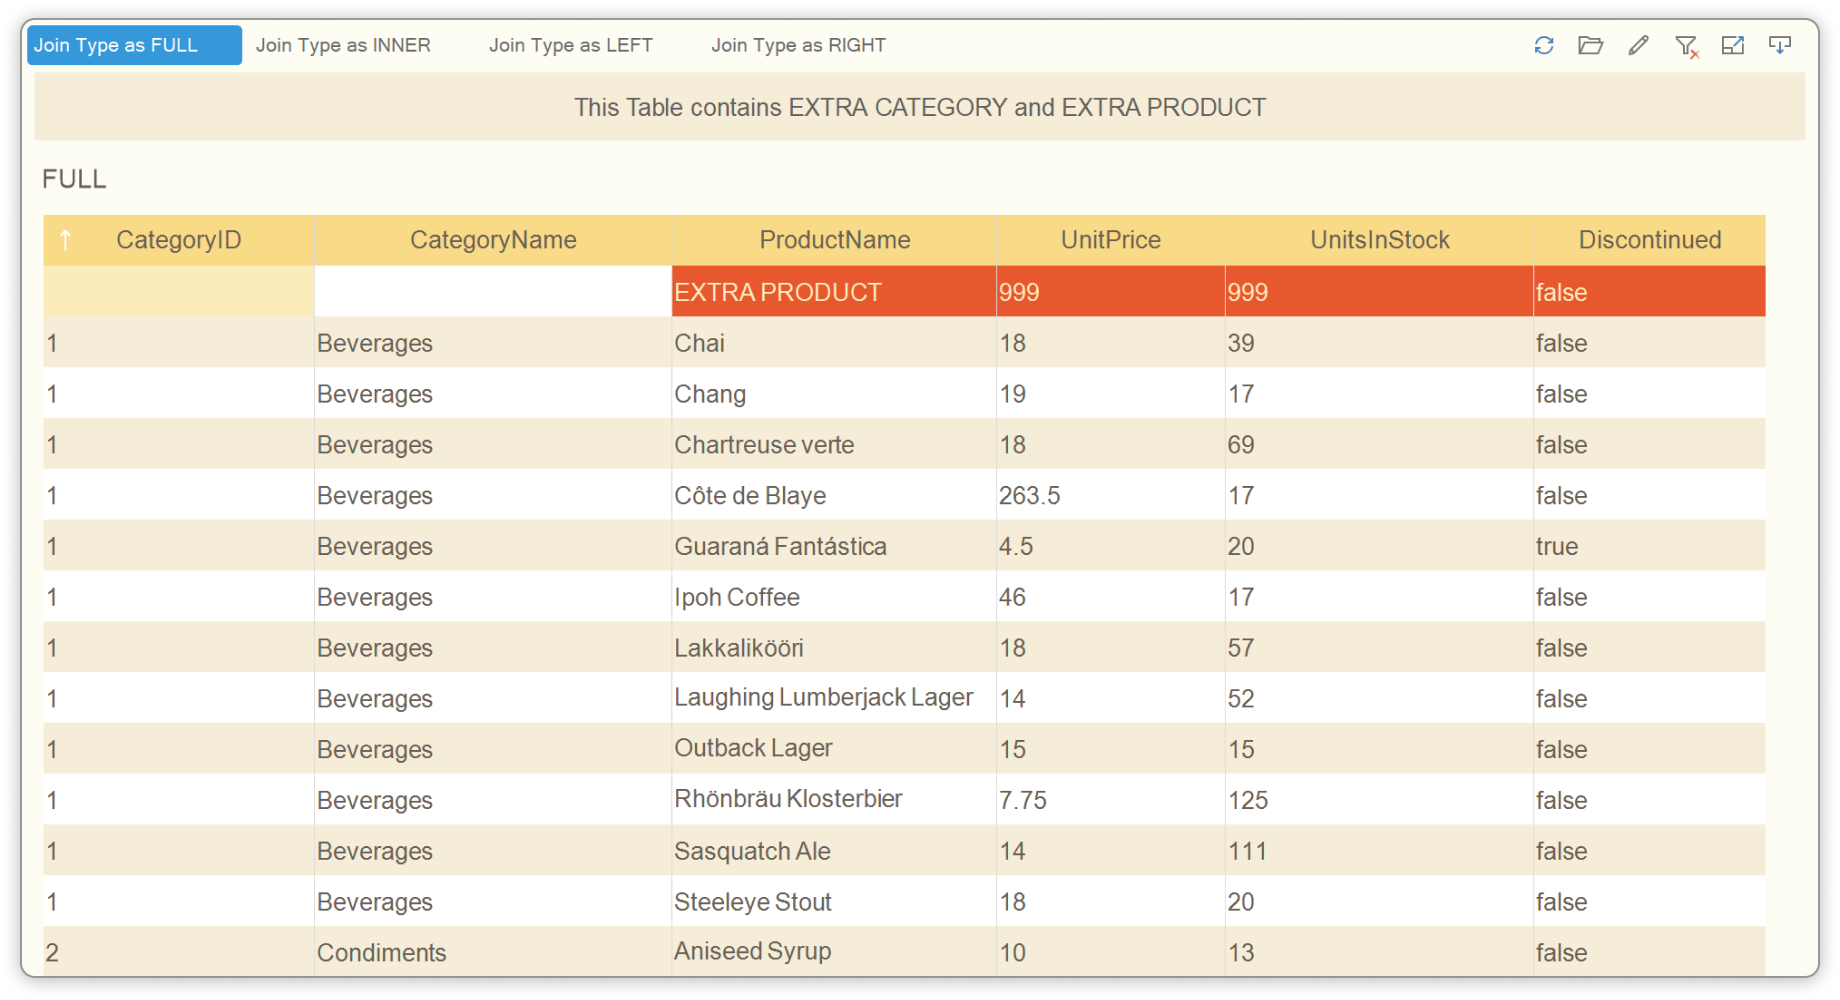
Aggregation for Date Time Step
We have added time-step aggregation in report charts. Previously, the step was calculated using only the average value. Now, you can choose from several data aggregation functions for the step: Average, Sum, Min, Max, and Count.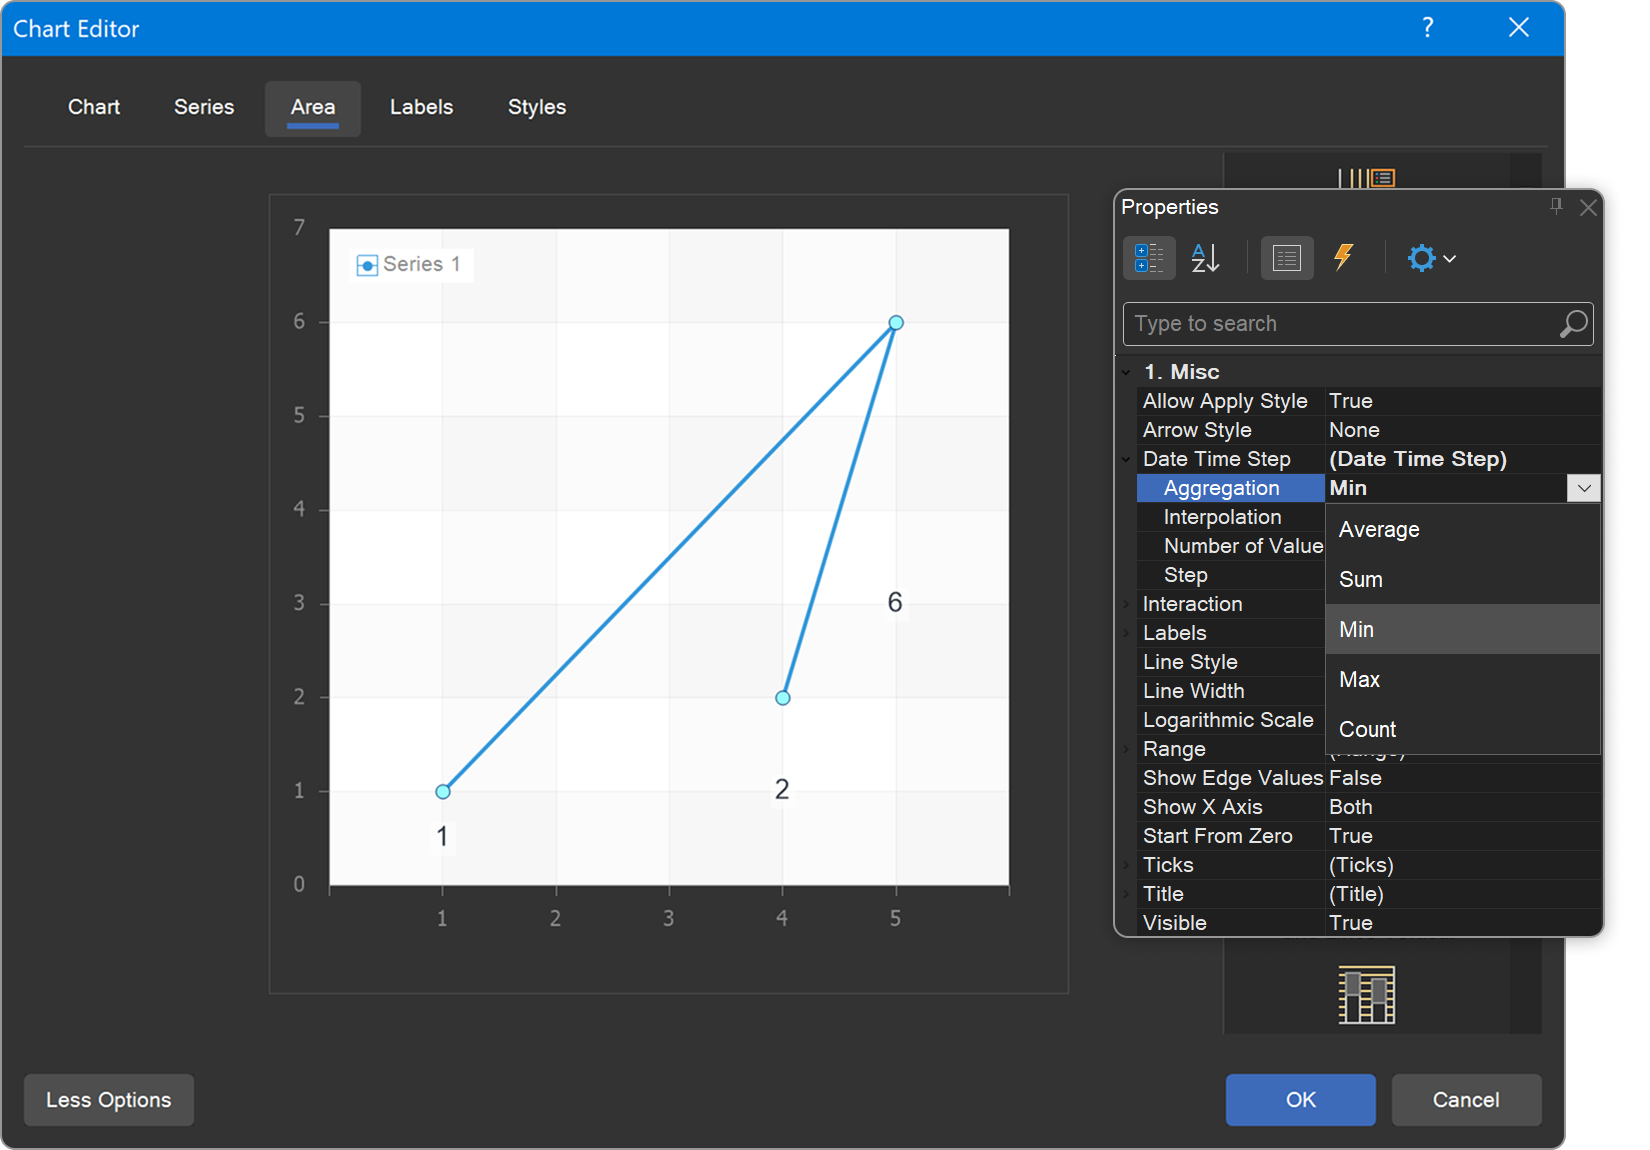
New features for 3D Charts
In 3D charts, axis label settings have been expanded - you can now rotate labels, limit their width, and enable word wrap mode. These adjustments can be made using the Angle, Width, and Word Wrap properties.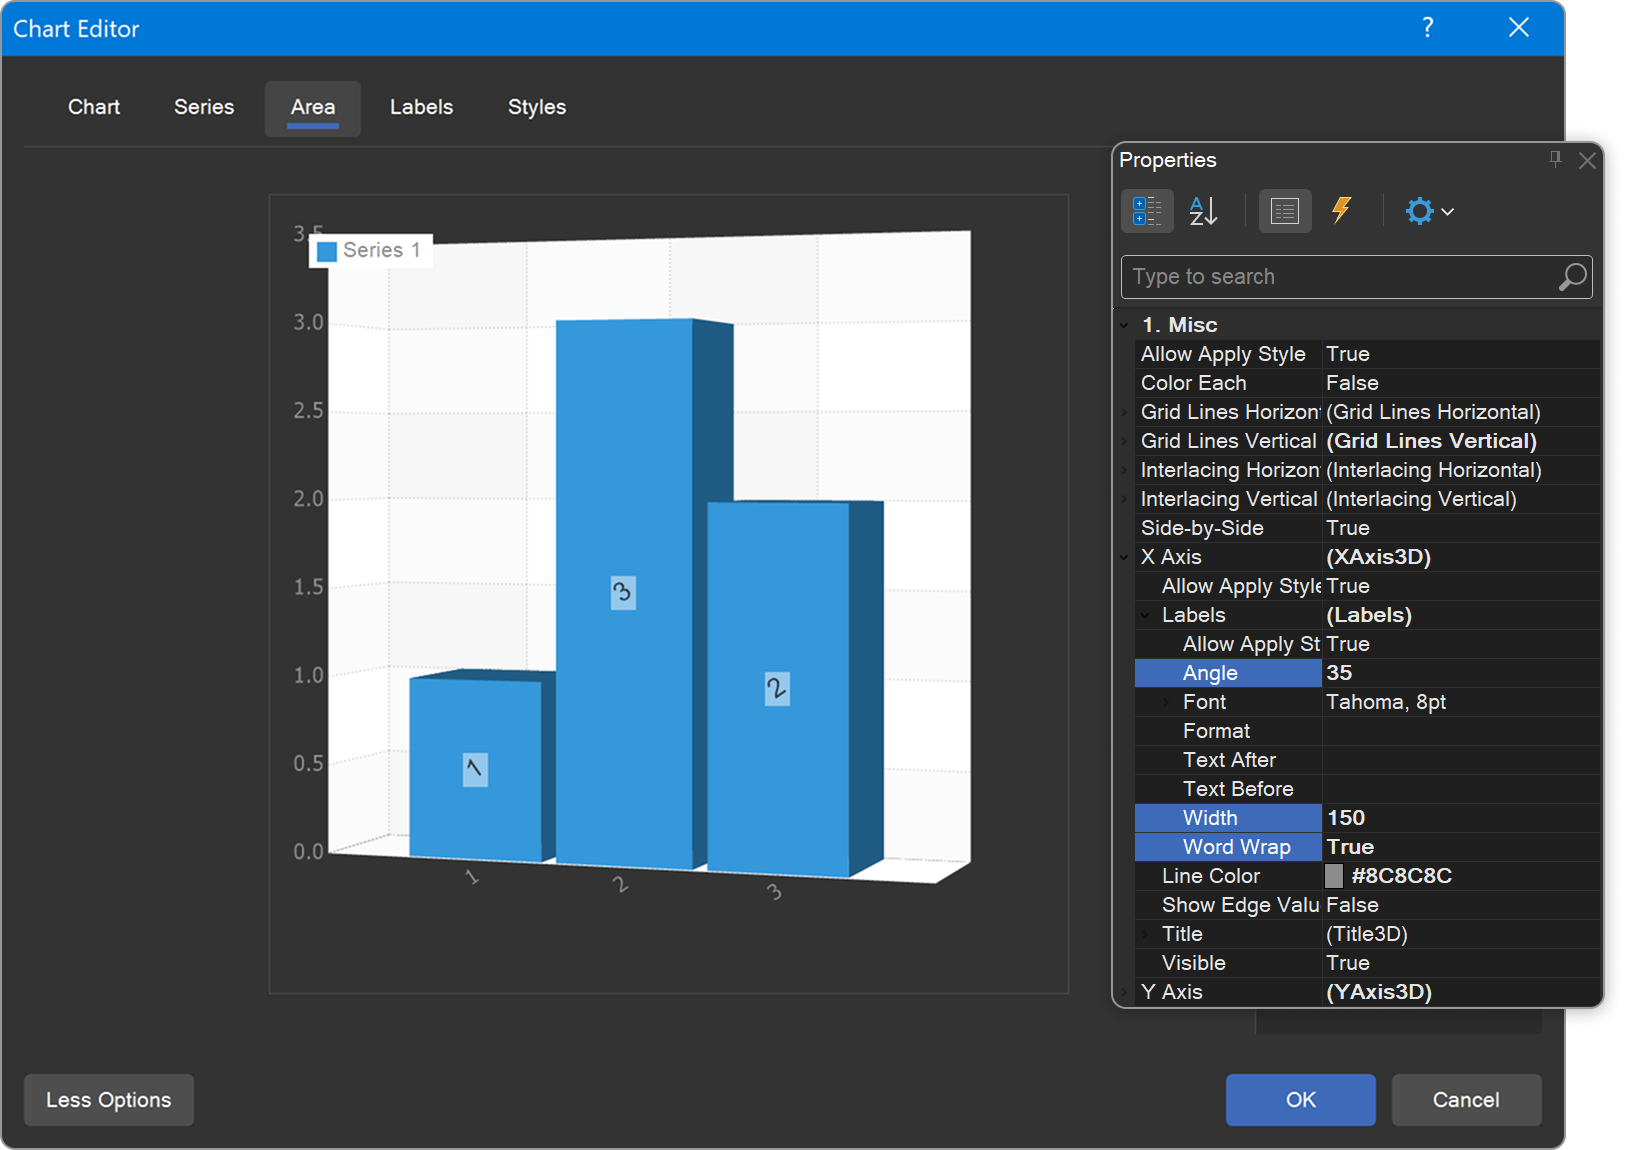
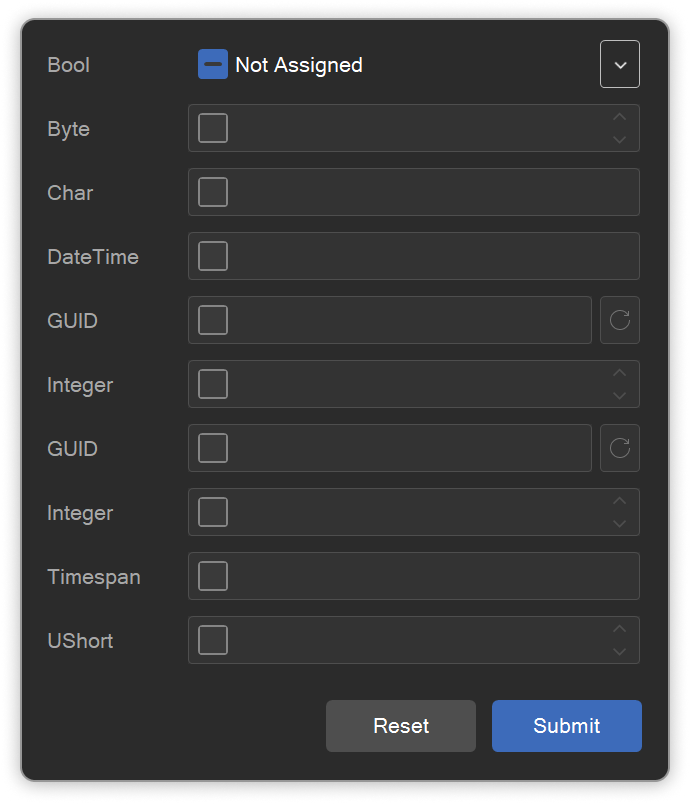
Nullable State for Variables
We have implemented support for the Not Assigned state for all variable data types in the Parameters Panel. In the variable editor, you can now set the Not Assigned option, which corresponds to the nullable state of the variable when viewing a report or dashboard.Eyedropper Tool in Web
In the Web Designer, we have improved working with the color palette. A new Eyedropper Tool with hover zoom has been added, allowing you to sample a color from any selected area of an image. Additionally, you can now copy the color code in RGB, HEX, and HLS formats.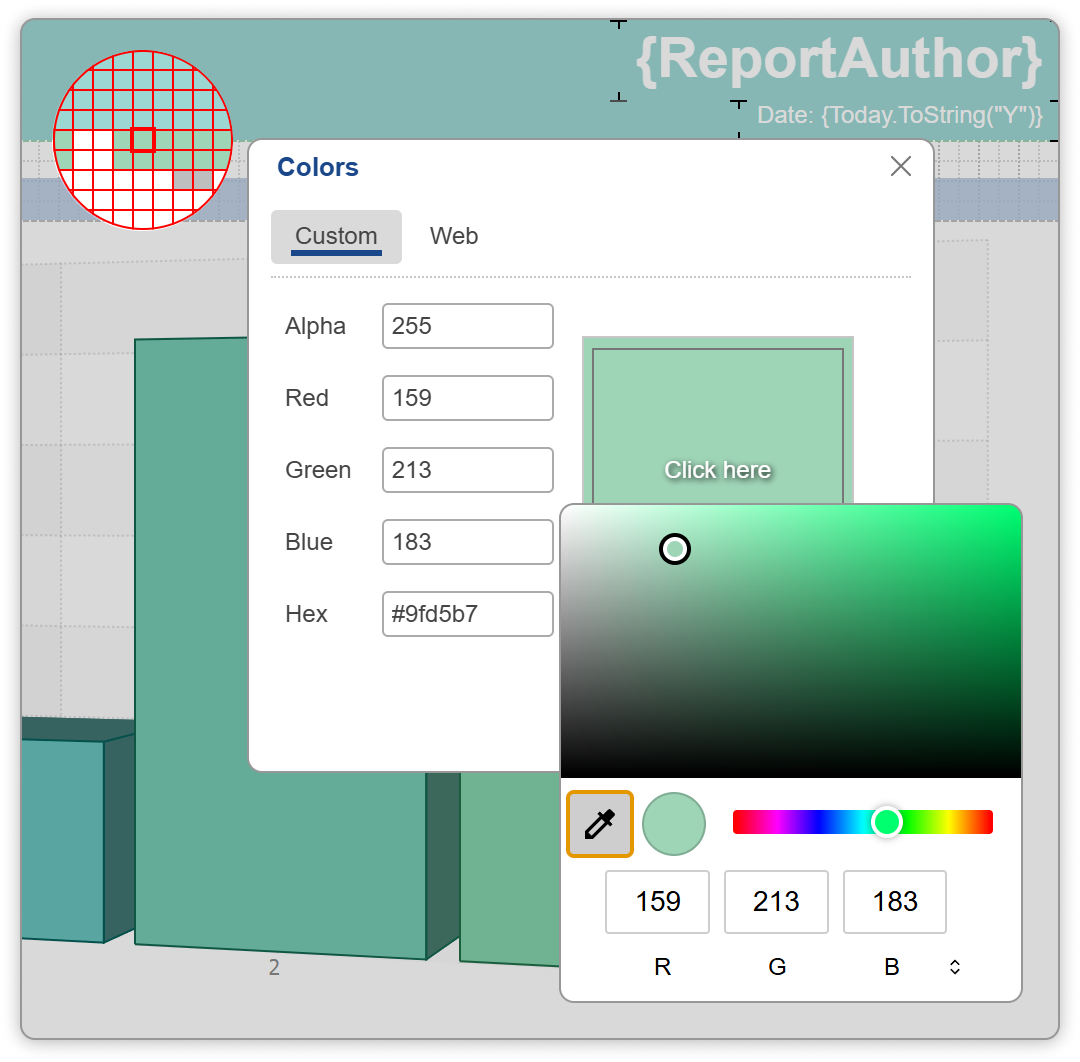
Report Tab in the Designer
A new Report tab has been added to the report designer. This tab contains the main commands for managing the report template, including Report Options, Preview Settings, Export Settings, and Globalization. It also includes a command for switching the Properties Panel to display report properties.Ready to explore version 2025.3?
The new version 2025.3 brings powerful updates to Reports, Dashboards, and PDF Forms. Build, visualize, and deliver your data with more flexibility and precision than ever before.Download a fully-functional 30-day trial and experience what’s new.