2021 was a hectic and productive year for our company. This year we have released two new products:
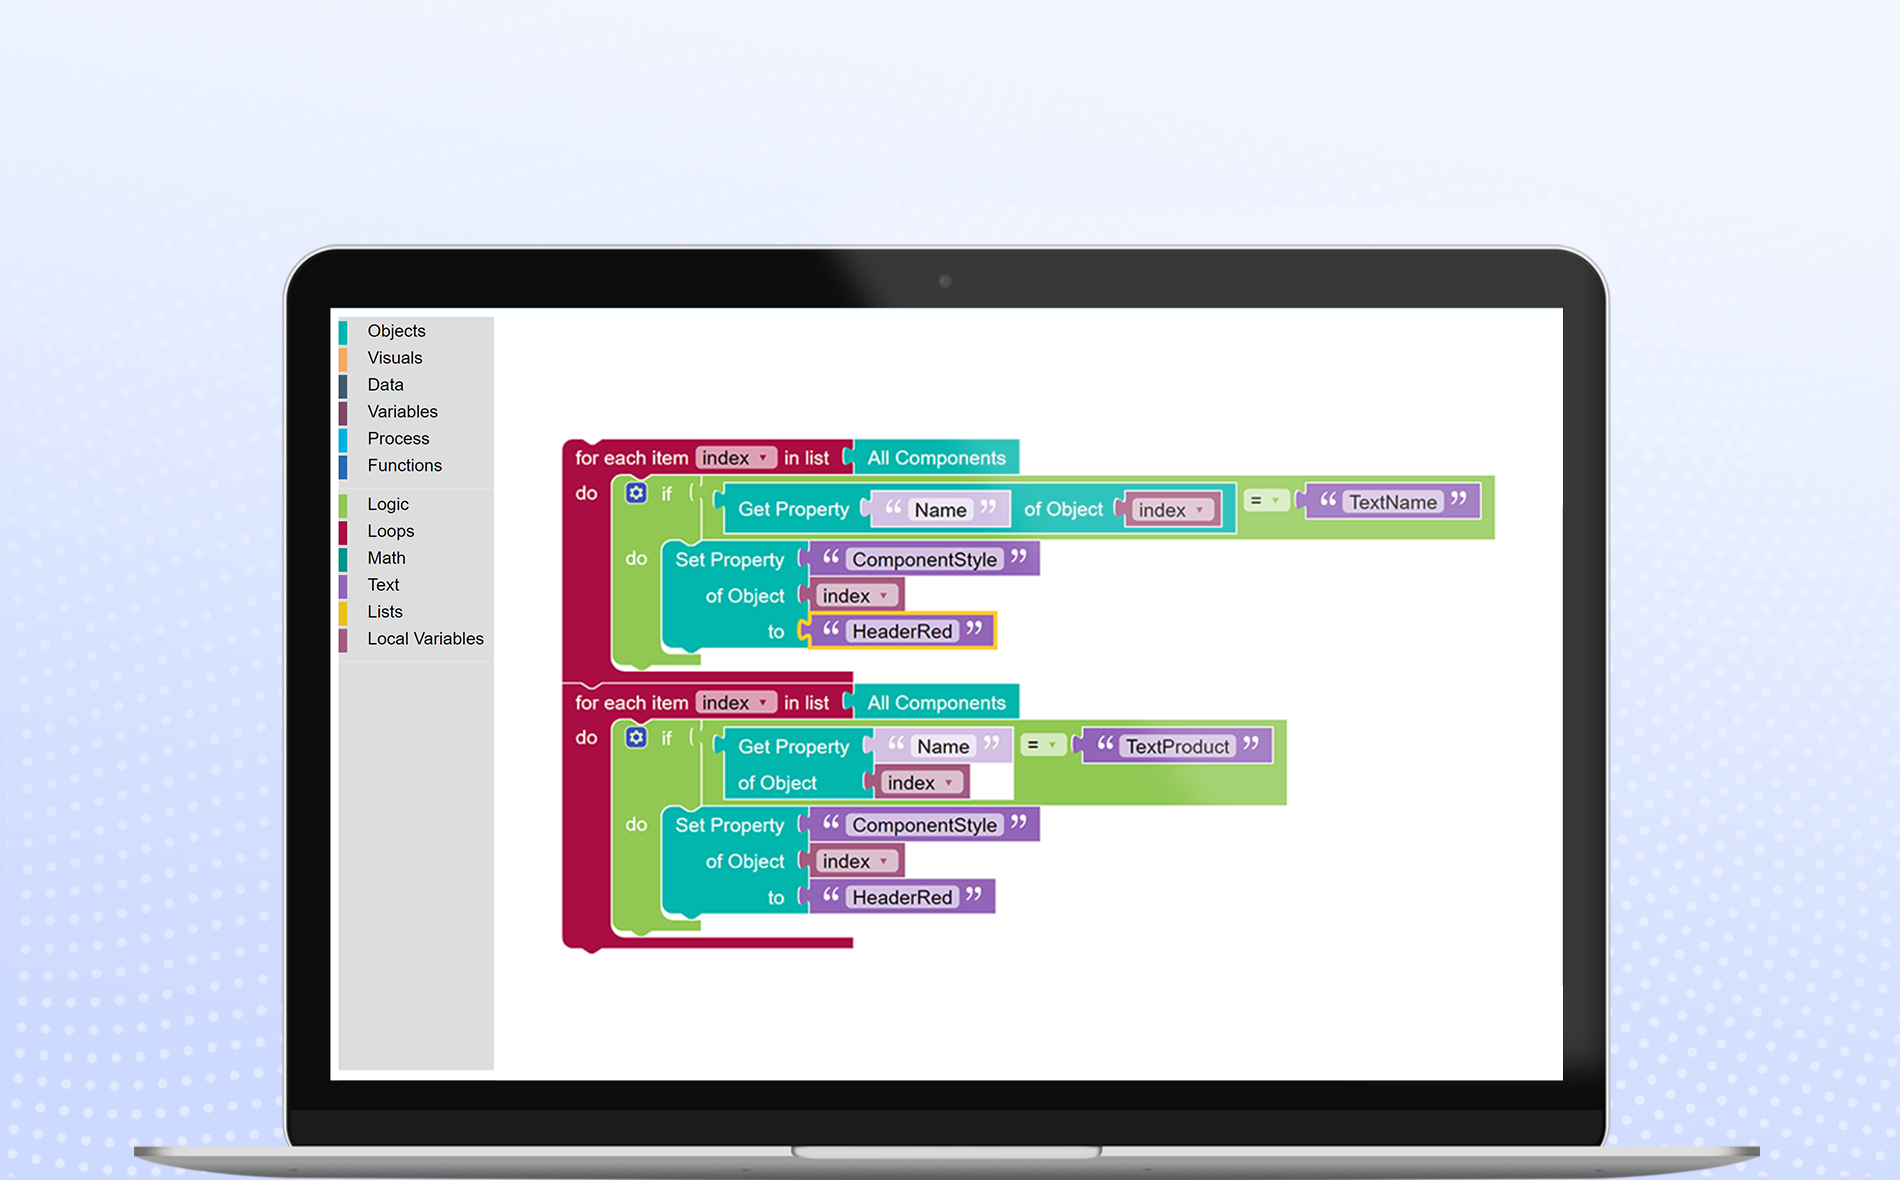
Reports.Blazor
Stimulsoft Reports.Blazor is a cross-platform tool designed to integrate applications using the Blazor framework. Our components support all the main features of Blazor, and can work both on the server-side and the client-side using WebAssembly technology. In Reports.Blazor, you may connect SQL, NoSQL, REST data sources and retrieve data from Google, Azure, Data.World, Quickbooks. All you need to work with the product is any modern browser.
Dashboards.PHP
Stimulsoft Dashboards.PHP is a new product in the line of tools for creating dashboards. You may use it to integrate seamlessly into your applications and as a standalone solution. At the same time, no complex configuration or third-party modules are required - the complex can be easily integrated into almost any PHP application.
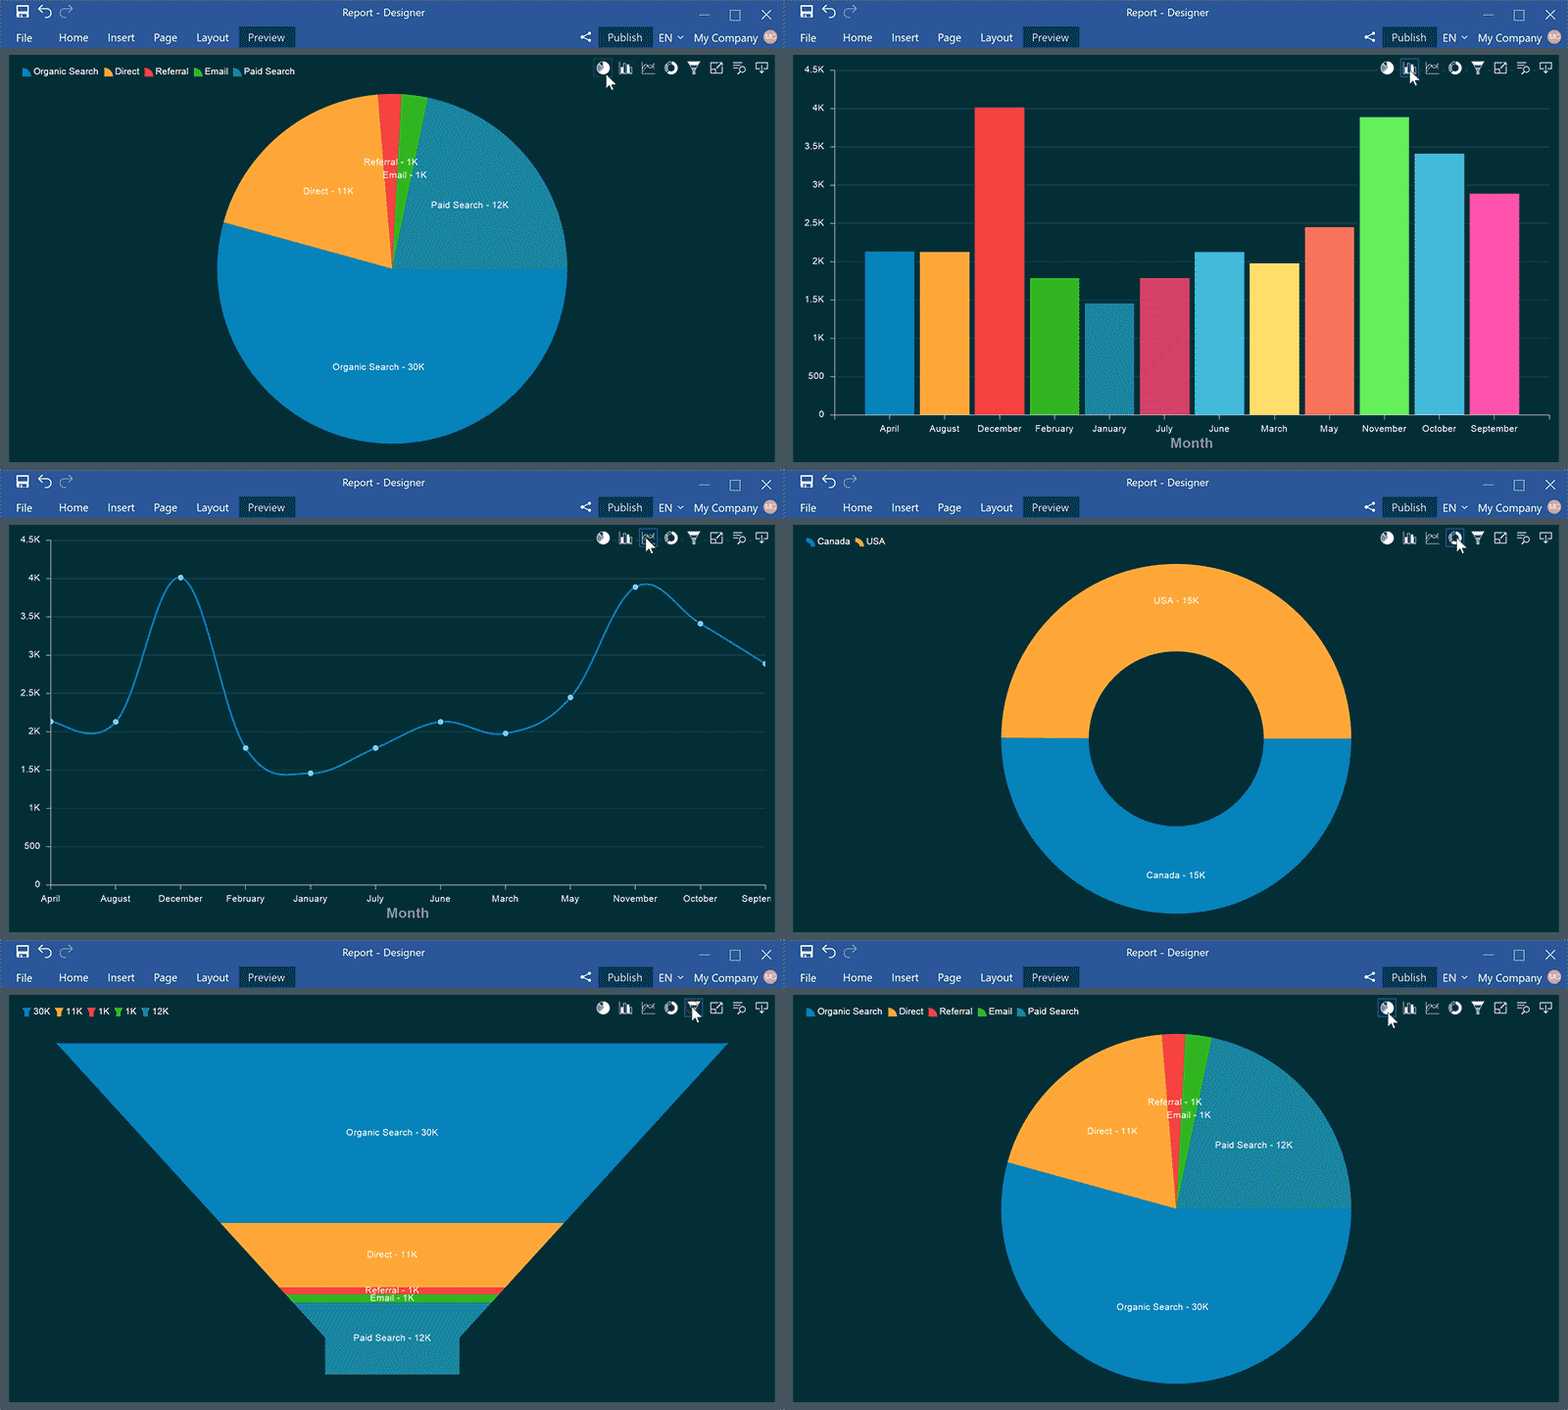
Several charts in one
For the Chart element in dashboards, you can specify up to 5 views. Each view is a separate type of diagram, and their switching is carried out in the viewer. The views are configured in the editor of the Chart element on the additional parameters panel.
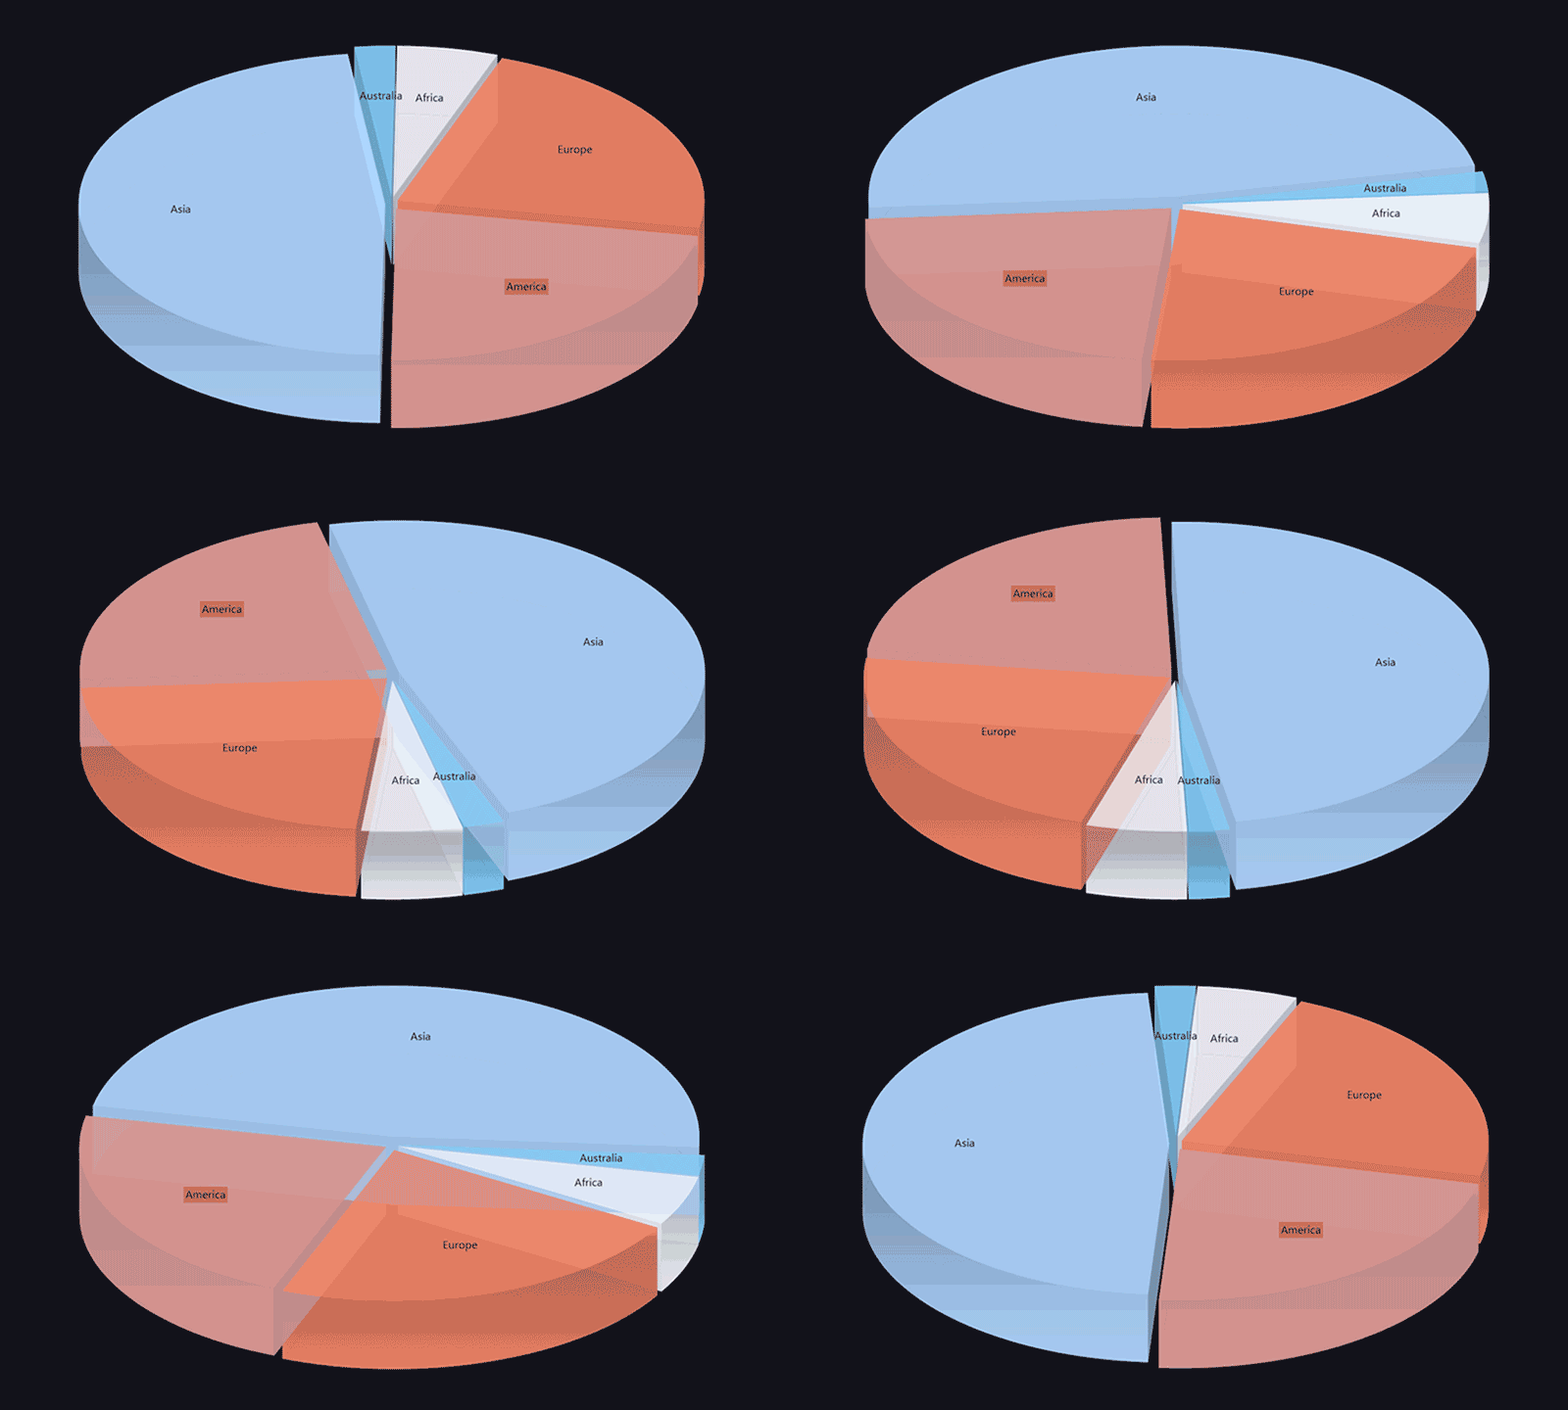
Pie chart now in 3D
A new feature you will like is a 3D pie chart - just look at it. The new type of chart has all the same capabilities. The appearance allows you to expand the visualization of data series and visualize the necessary data more clearly and visually.
Straight ahead
We are constantly keeping up with the times, so our products:
- support work under Windows 11;
- tested and work under .NET 6.0;
- support all current versions of the Angular platform - 10, 11, 12, 13;
- and the source codes are fully compatible with Visual Studio 2022.
New data adapters
We also have new data adapters - Google Analytics, Azure SQL, and Azure Blob Storage. With their help, you can build complex and functionally rich reports and dashboards, including web analytics reports. Also, we added support for PDO data adapters for PHP.
New functionality
A few more new things will make your work with our products even more convenient and fast. Reports can now be built and sent by schedules; you may add watermarks, transparency of elements to dashboards; variables have new capabilities; optimization of JS scripts (the total volume of code reduction is about 20 percent) affected Reports.JS, Dashboards.JS, Reports.PHP, and Dashboards.PHP.
Thank you for being with us! See you in 2022!


