Not so long ago, we released version 2021.3 with new functionality and improvements. We have already published articles about views in a chart, dependent variables of the List type, column visibility and many others. In this article, you will know about the improvement of table conditional formatting in dashboards.
What is conditional formatting?
Conditional formatting allows you to change design settings when a specified condition is met. It's one of the data analysis capabilities when certain tendencies are highlighted in the list with a different color, style, font size, or other design settings.In the 2021.3 version, we have added several capabilities to use conditional formatting when creating a dashboard flexibly. In earlier versions, there was a lack of settings to use conditional formatting widely.
Earlier

Firstly, only a static value could be specified as the second condition value, and it was not possible to specify an expression. Accordingly, you were not able to make the visual analysis dynamic. For example, when some two values from data columns are compared with.
Secondly, it was not possible to define table columns for which you should apply conditional formatting. In other words, you had to set conditions for each column, which design needs changing.
Now
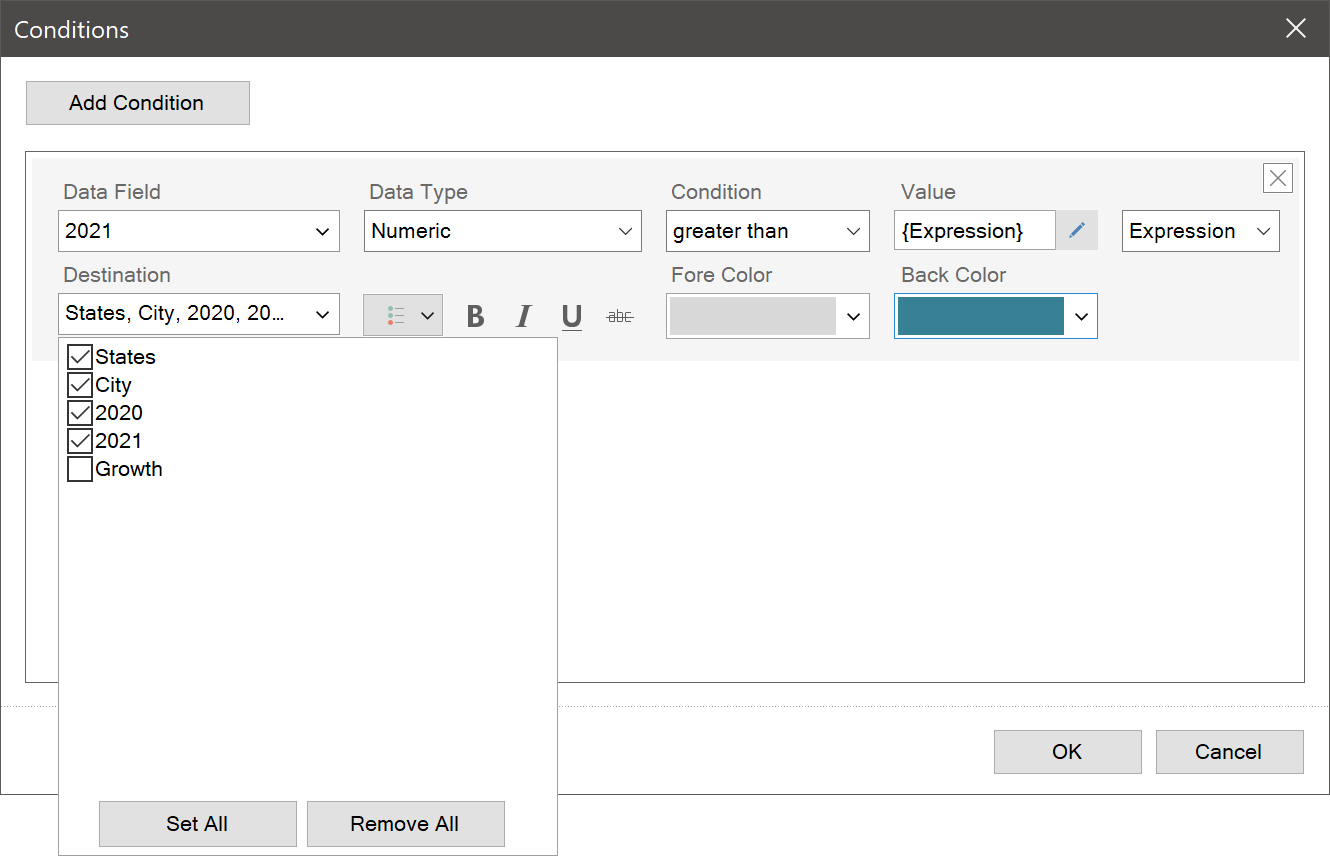
Now things are different. You can specify the expression, which calculation result will be the second condition value. To do it, you should define the Value parameter as the Expression.In addition, you can define the columns for which you should apply conditional formatting. You can do this in the Destination parameter. You should select the table columns, which design you want to change.
Now the use of conditional formatting in dashboards is quite easier, and visual data analysis may be dynamic.
We have prepared a video lesson about this and one report sample with the new condition editor functionality.
We hope this article will help you understand the new functionality of Stimulsoft products for report and dashboard creation. If you have any questions, contact us – we will be glad to help you.