In this article, we will dive deep into the technical details of creating reports and discuss the display mode of the chart axis, Date Time Step, as well as its properties: Interpolation, Number of Values, and Step.
Today, our attention will be on the Date Time Step mode.
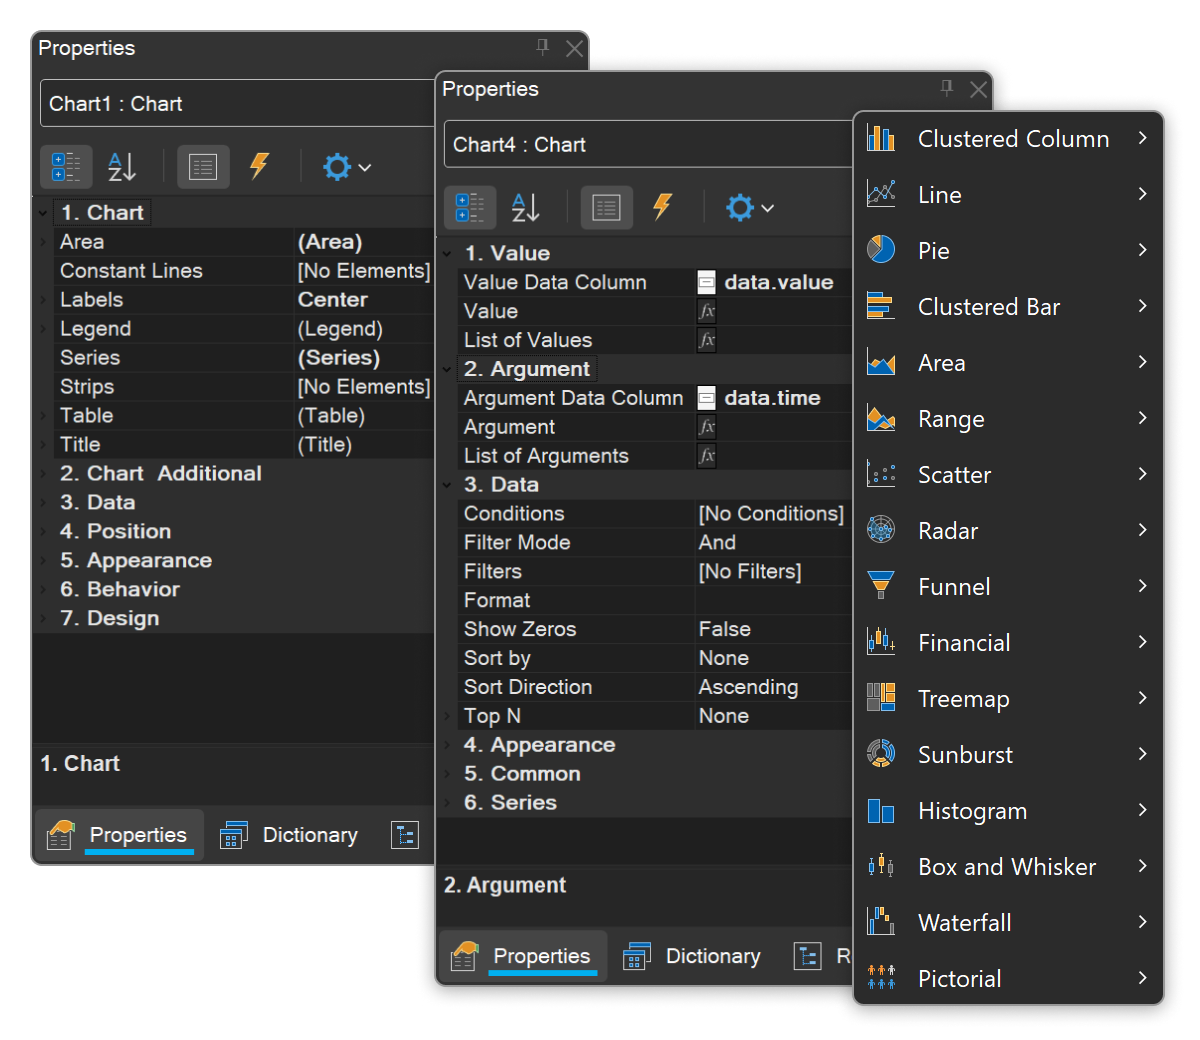
An example of using this mode might be a situation where the X axis is labeled with time (Date Time) values instead of simple numeric values, corresponding to the values on the Y axis. But first things first.
The mode contains three properties:
Let's take a closer look at each property.
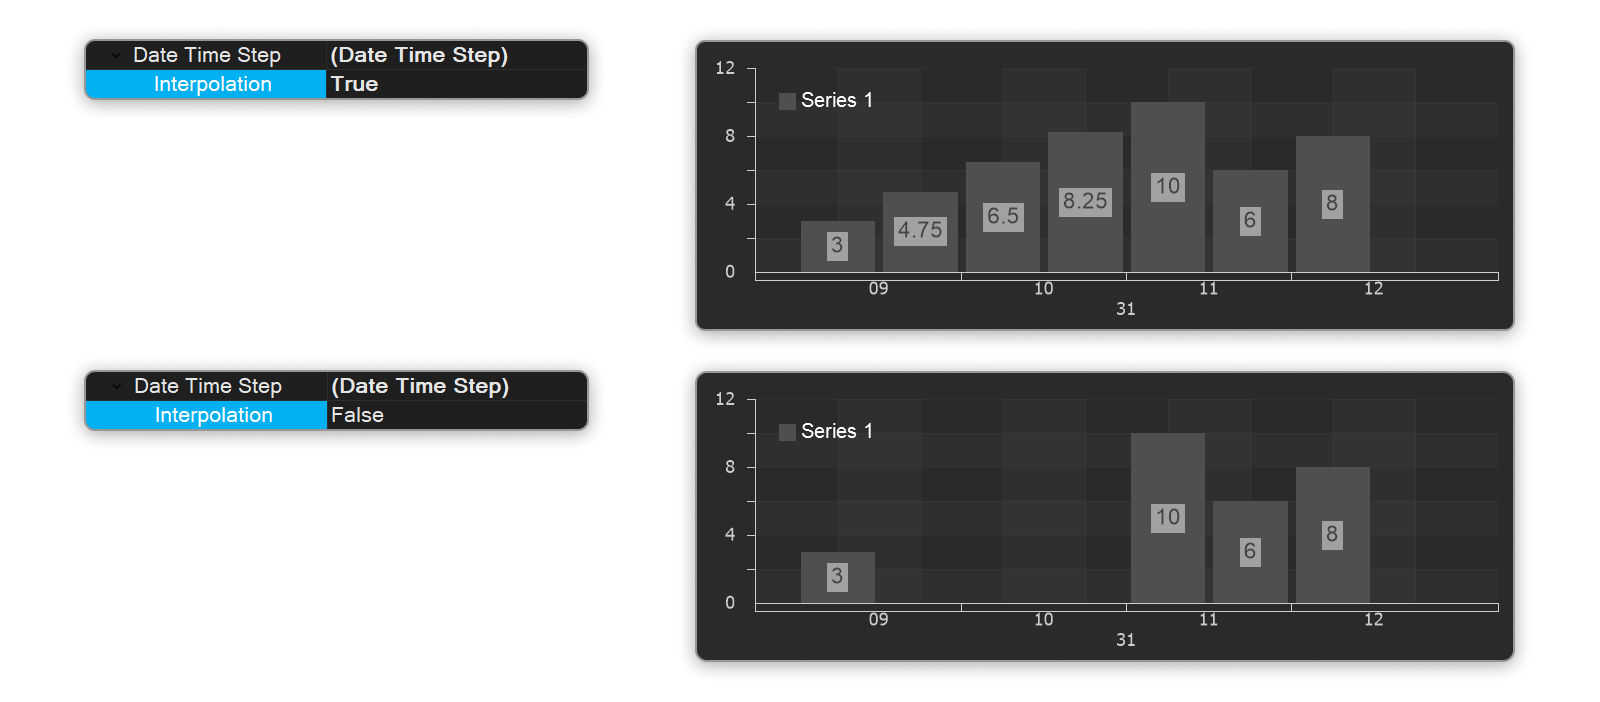
Example: If there is no data between values 3 and 10, interpolation will calculate values that logically fill that gap.
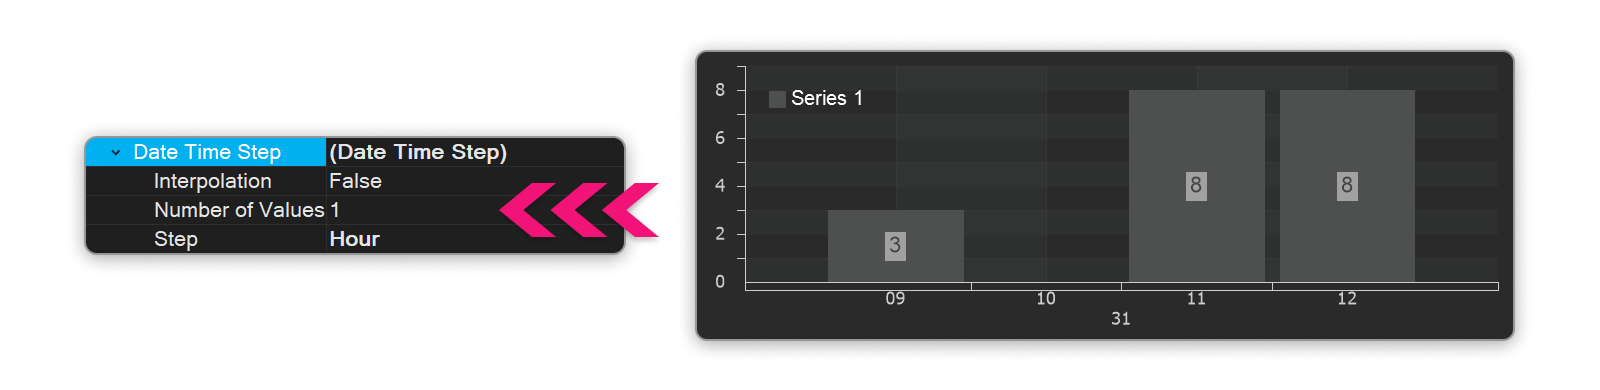
Example: If the step is set in hours, then the number of values on the chart will depend on the Number of Values property. If the Number of Values is set to 1, then only ONE average value will be output for each step:
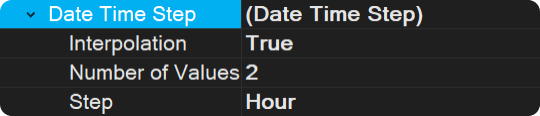
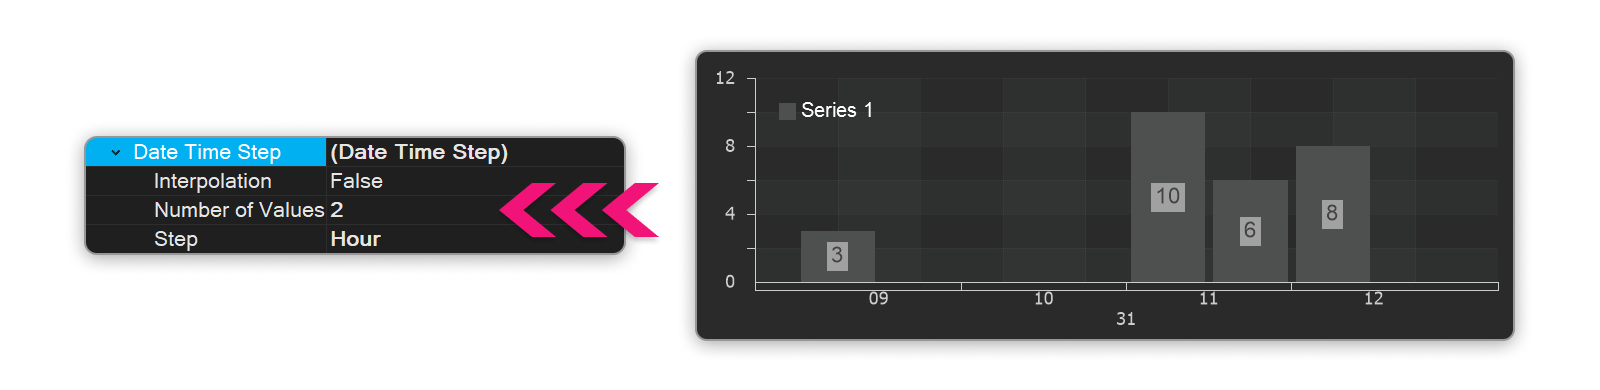
Example 2: If the Number of values is set to 2, then 2 values will be output for every hour:
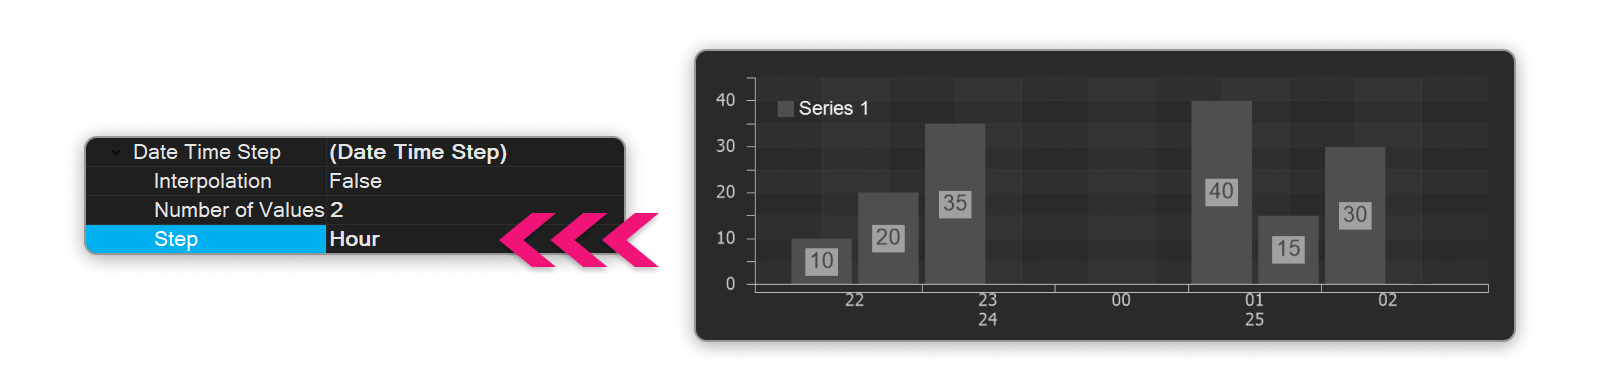
Example (with hourly increments): If the increment is set to one hour, the axis will display marks (bars) every hour.
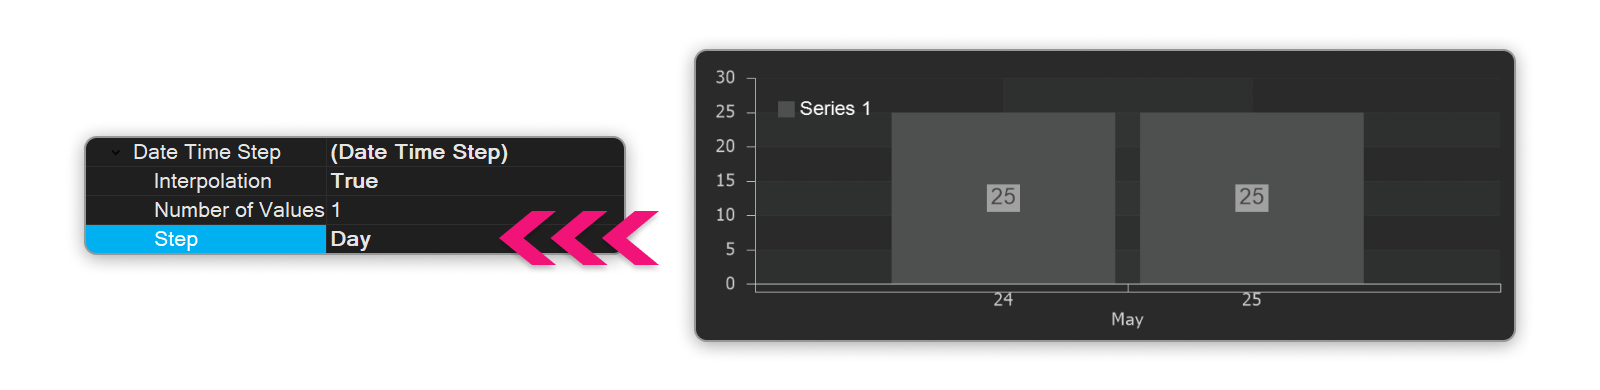
Example (step is equal to one day): If the set step is equal to one day, then labels (or segments) will be displayed on the axis at intervals of one day.
Introduction
The Stimulsoft report designer offers dozens of types of charts, ranging from ordinary line graphs to three-dimensional charts. There are many properties and settings available to configure them.Today, our attention will be on the Date Time Step mode.
An example of using this mode might be a situation where the X axis is labeled with time (Date Time) values instead of simple numeric values, corresponding to the values on the Y axis. But first things first.
Date Time Step
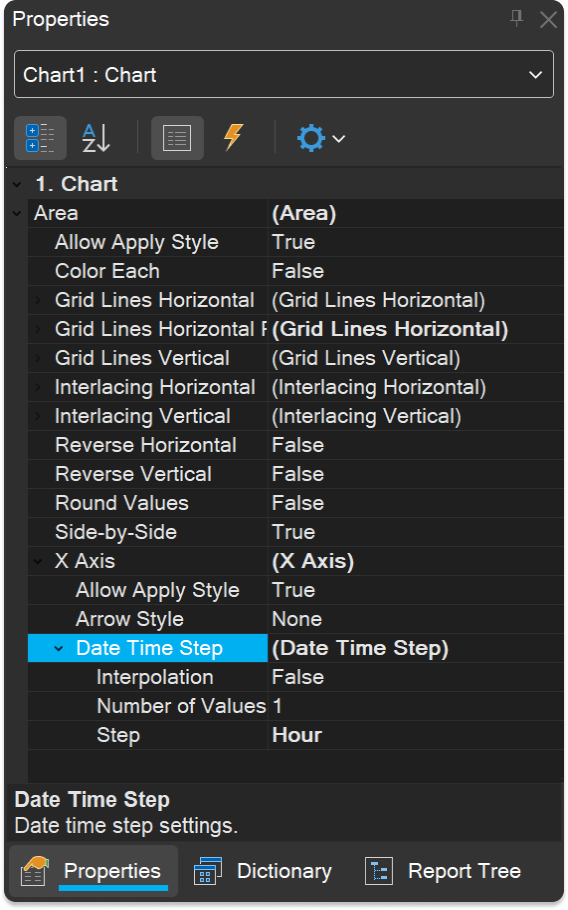
Time step is a display mode of an axis in which time intervals are displayed indicating time intervals: minute, hour, day, and so on.The mode contains three properties:
- Interpolation;
- Number of values;
- Step.
Let's take a closer look at each property.
Interpolation
The Interpolation property allows you to automatically calculate intermediate values between the two closest original values for intervals where no values exist.Example: If there is no data between values 3 and 10, interpolation will calculate values that logically fill that gap.
Number of values
The Number of Values property is used to specify the maximum number of values displayed within the selected time step.Example: If the step is set in hours, then the number of values on the chart will depend on the Number of Values property. If the Number of Values is set to 1, then only ONE average value will be output for each step:
Example 2: If the Number of values is set to 2, then 2 values will be output for every hour:
Step
The property is used to specify the time period that will be used for the axis.Example (with hourly increments): If the increment is set to one hour, the axis will display marks (bars) every hour.
Example (step is equal to one day): If the set step is equal to one day, then labels (or segments) will be displayed on the axis at intervals of one day.