We continue to tell you about the new version of Stimulsoft Reports and Dashboards 2022.1 and about new features and improvements, which are already available for our users. Before, we wrote about 3D Pie chart, and new barcodes. Today, we will tell you about new features of data transformation.
What is data transformation
The Data Transformation is a tool in the report designer, which is intended to create a new data description in a table. The thing is that data in the dictionary is contained in a structured view, more often in tables. When creating reports you should combine data from various tables to group, filter them, and calculate totals, etc. To do that, you can write a sql query with suitable parameters or for example, change data structure in a source. The Data transformation allows you to make such actions using visual methods.New features of the 2022.1 version
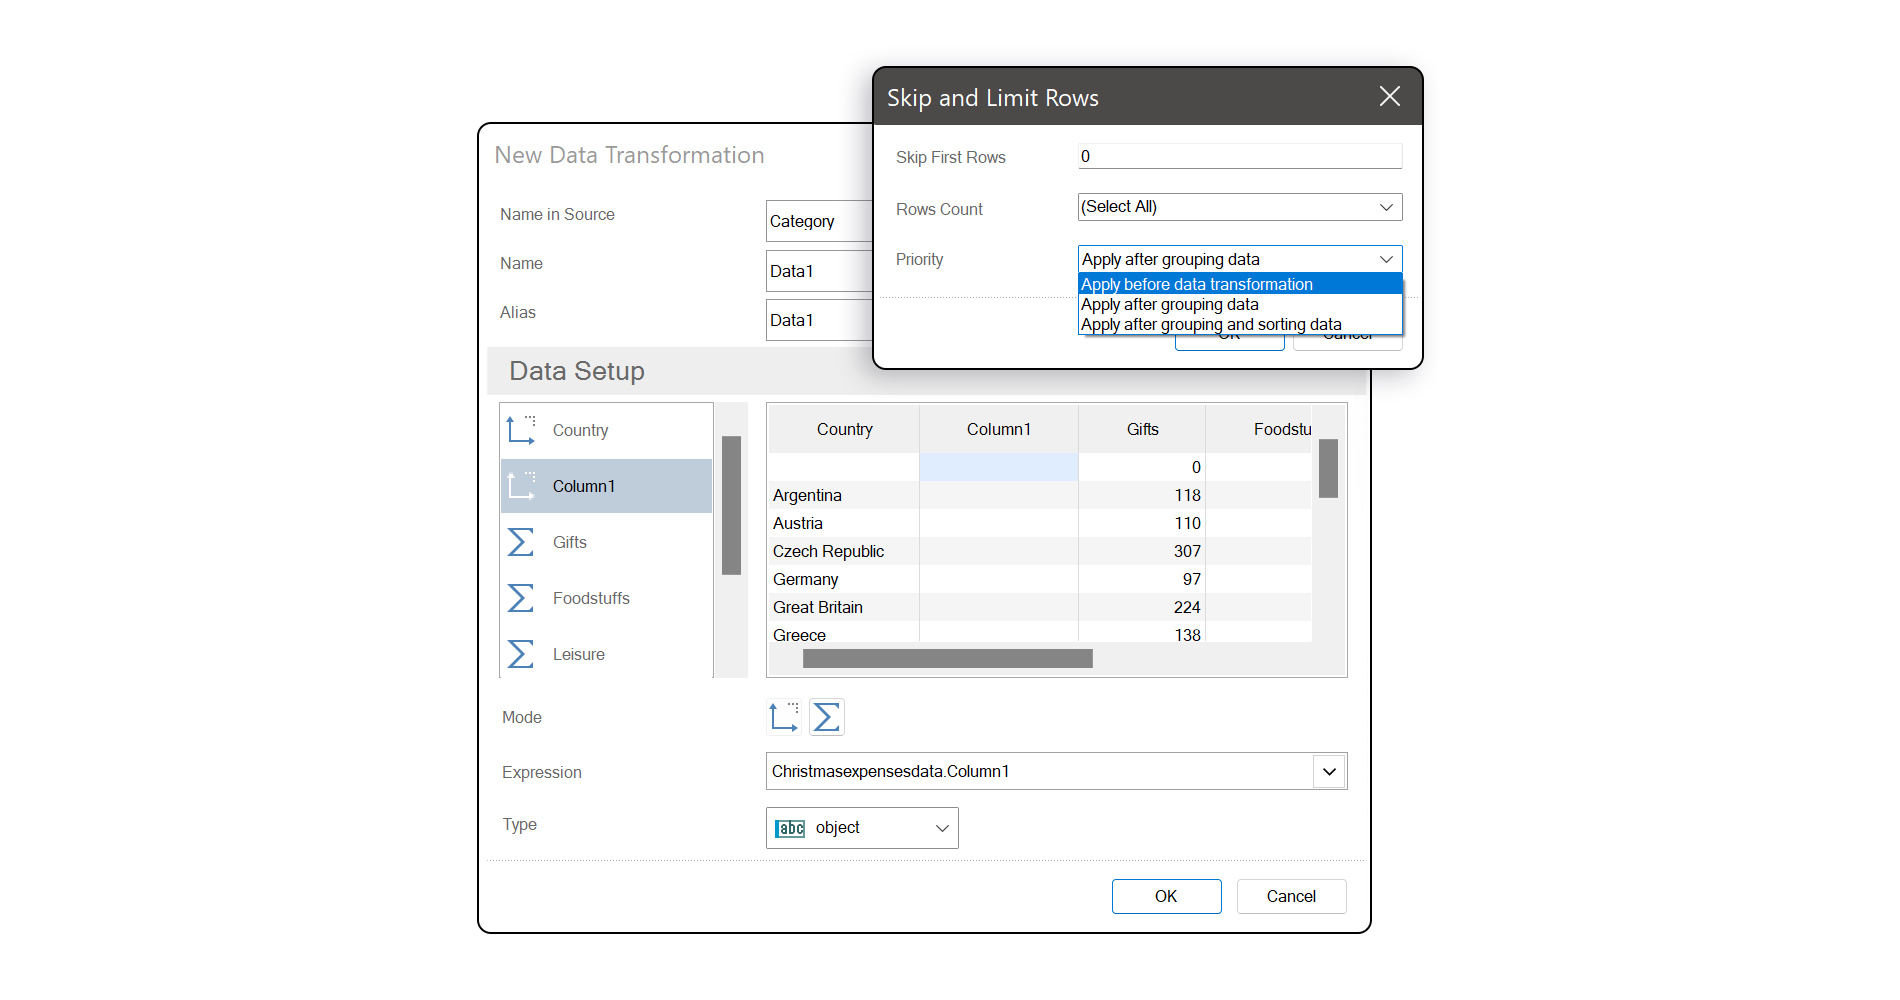
Since the 2022.1 version, a new feature was added to the Skip and Limit Rows action and in the Data Transformation tool. Apart from such values as Apply till data transformation and Apply after grouping data, Apply after grouping and sorting data value was added. In this case, limit rows will be applied after grouping data according to the specified sorting.
How it works
Let's look at the example of work of this new feature.In case of using the Apply till data transformation, limit and skip rows will be applied to original data, i.e data in the order where they are placed on the storage.
In the Apply after grouping data mode skip and limit of rows will be applied to data, which are already grouped by some reason in transformation. It's worth noting, that when grouping data are sorted from A to Z. Custom sorting, which is set in data transformation will not be considered.
In the Apply after grouping and sorting data mode, limit and skip rows will be applied as well as in the mode of applying after grouping, only considering custom sorting in data transformation. In other words, firstly data will be grouped, then sorted and limit and skip rows will be applied.
Watch a video about this new feature of data transformation. If you have any questions, contact us.