In the previous article we acquainted you with the report designer – told you about how and where you can download and install it, about skill levels, and how they exert influence over work with the application. Also, you learned about developer packages for integrating the reporting system into your application. This time, we will tell you about work with the report designer, and today we’re starting with the first and crucial step – data connection.

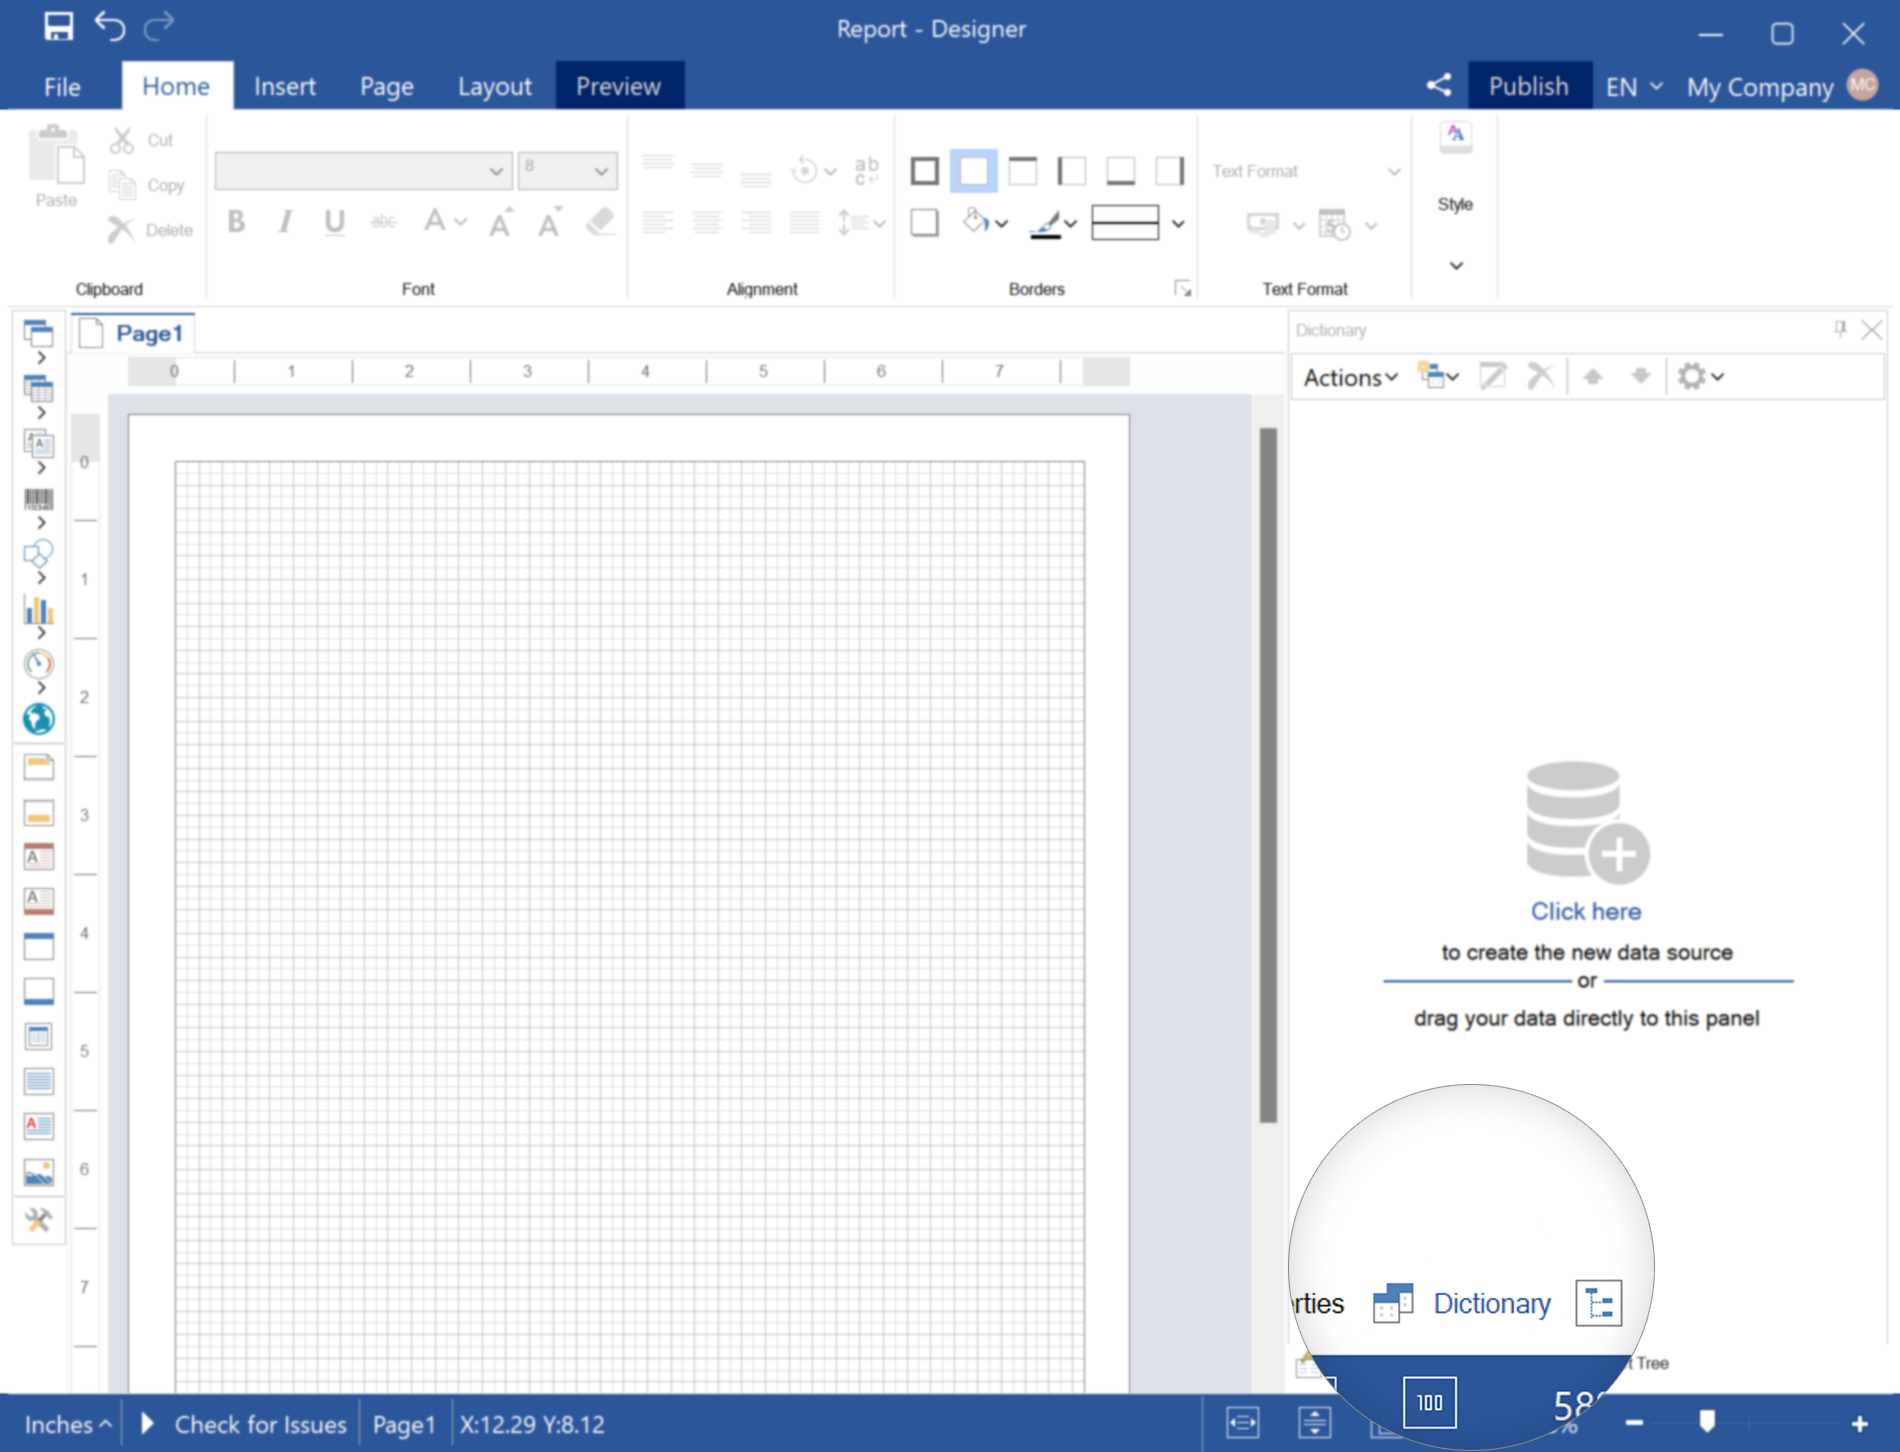
You should find the New Item in the dictionary and click the New Data Source. The next step is to select a data source type, and you can select any of all provided. We’re going to take MySQL, for example. Remember!
Data adapters in Stimulsoft reporting tools can be embedded or external. After selecting a data source type, the report generator checks out installed adapters in the following path. If there is no current adapter, you’ll be offered to download it. To do this, you should click the Download button, and after that, the report generator will download and install the adapter you need.

So, a connection has been created. Now, in the Select Data window, you should select data tables that you want to see as data sources in the dictionary. There’s the New Query for SQL data sources button that is used to create a query.
On the basis of selected data sources, you can create reports and dashboards. Reminder!
You can edit connected data sources, having changed your request, the number of columns, their type, name, aliases.You can find more detailed information about how to create MySQL and other data sources in our documentation.
Any external file with data can be embedded to report resources. Read about how to do this here.
On our YouTube channel, we have put together a large playlist of video tutorials about working with data.
Why do I need to connect data?
As we have already told you, the data connection is the first step when working with the report designer, so as you’re not able to create a report or dashboard without data. This process is carried out in the dictionary and includes the following steps:- creating data sources;
- creating connections.
Creating data sources
The dictionary contains the entire list of all sources and their connections. Firstly, to create a data source, you should run the report designer and go to the dictionary.
You should find the New Item in the dictionary and click the New Data Source. The next step is to select a data source type, and you can select any of all provided. We’re going to take MySQL, for example. Remember!
Data adapters in Stimulsoft reporting tools can be embedded or external. After selecting a data source type, the report generator checks out installed adapters in the following path. If there is no current adapter, you’ll be offered to download it. To do this, you should click the Download button, and after that, the report generator will download and install the adapter you need.
Creating connection
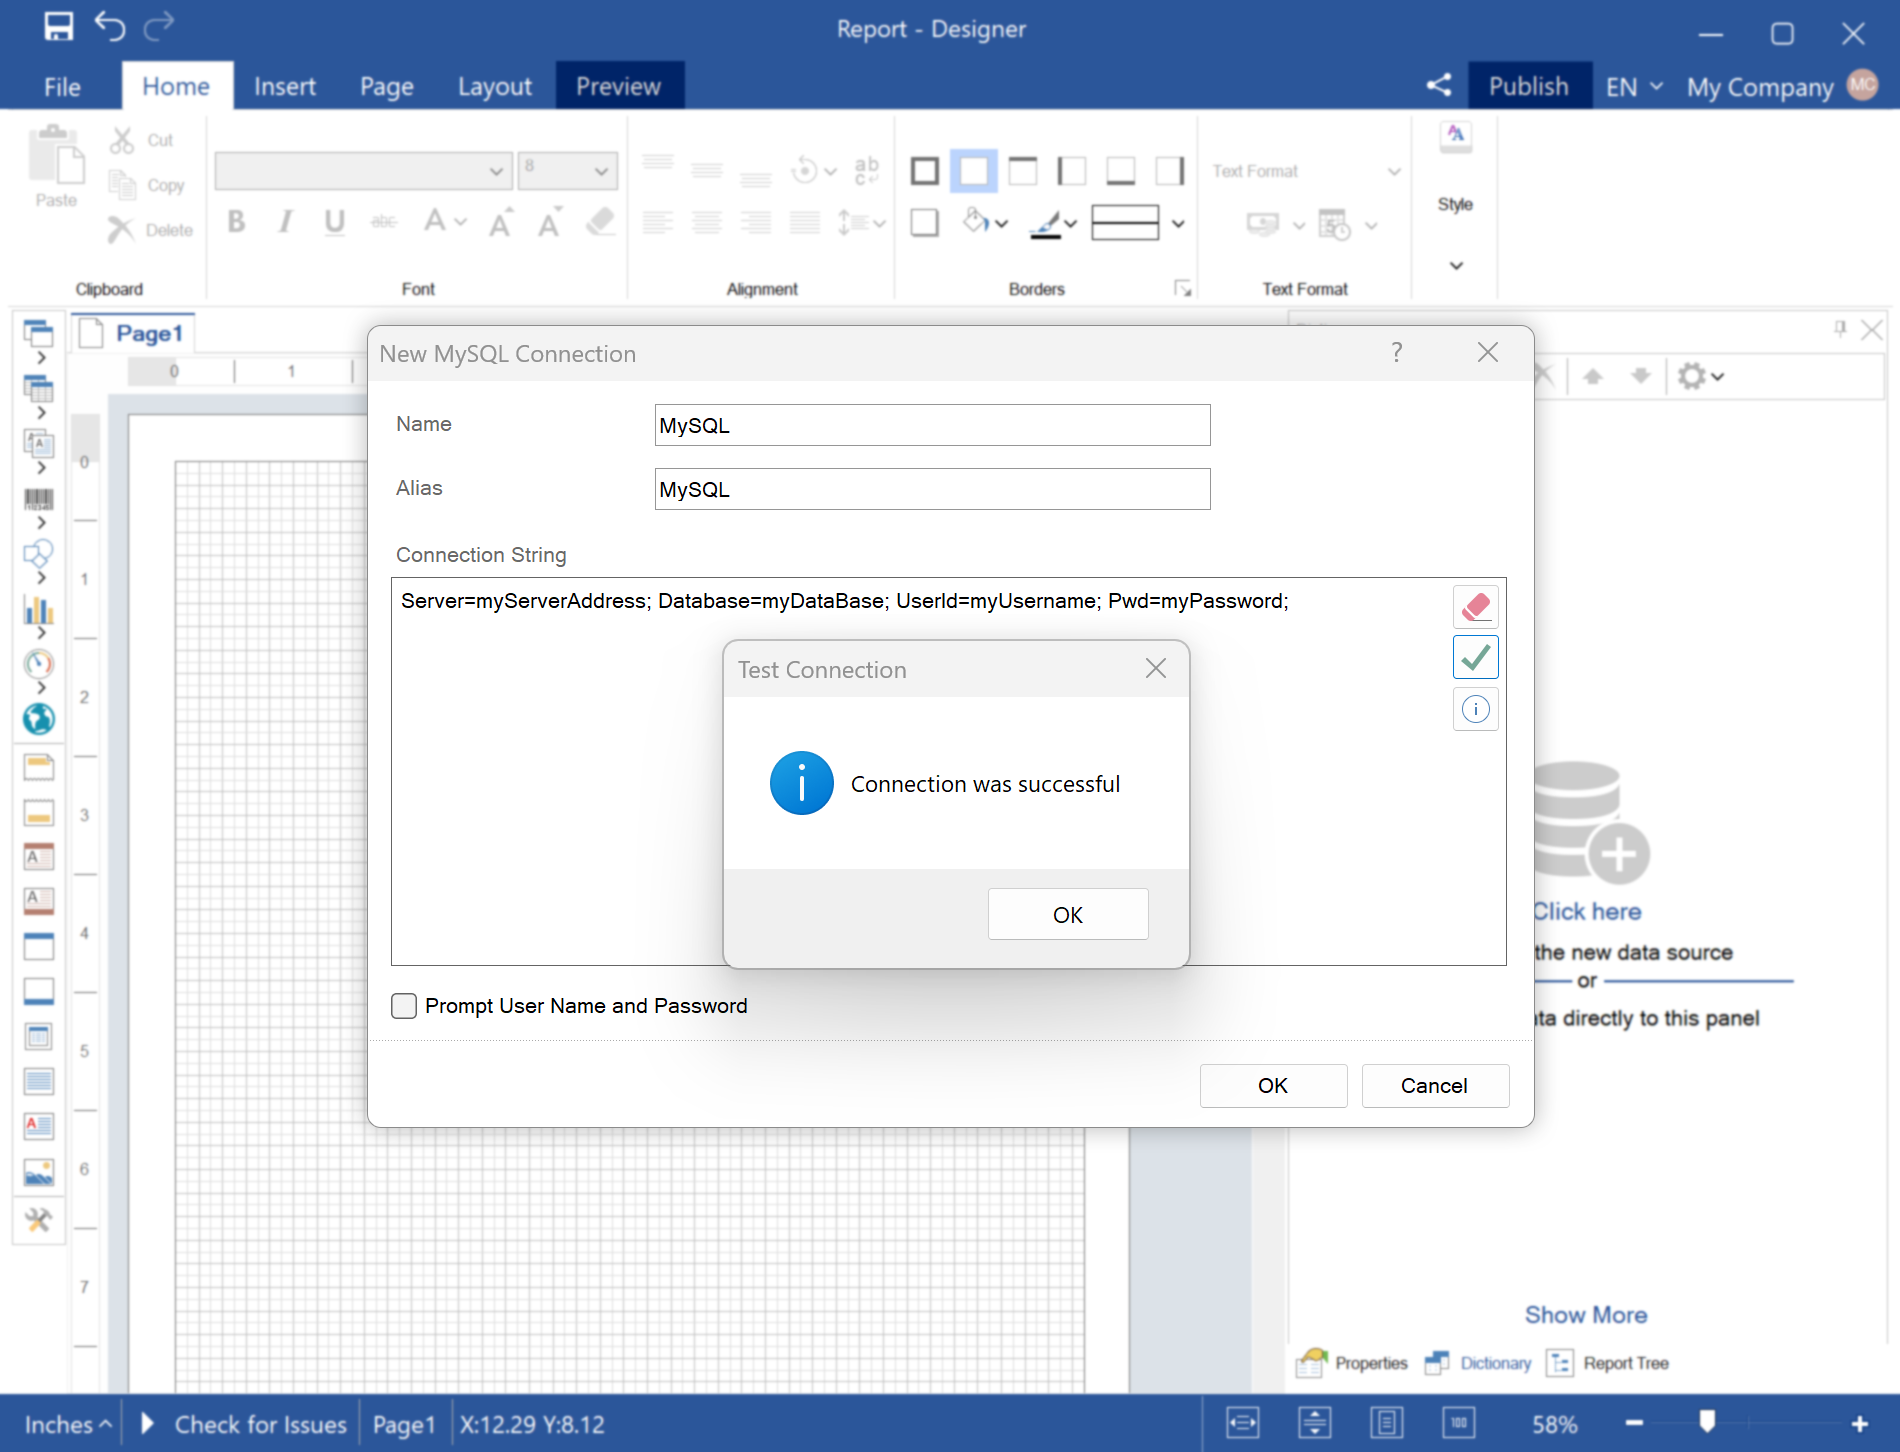
After installing a data adapter, you will see the window of creating connection to data storage. You should check the connection in this window, having clicked the Test button. At the end of testing connection, the following message will be displayed:
So, a connection has been created. Now, in the Select Data window, you should select data tables that you want to see as data sources in the dictionary. There’s the New Query for SQL data sources button that is used to create a query.
On the basis of selected data sources, you can create reports and dashboards. Reminder!
You can edit connected data sources, having changed your request, the number of columns, their type, name, aliases.You can find more detailed information about how to create MySQL and other data sources in our documentation.
Creating a file data source
When creating reports, you can retrieve data from the following files: CSV, Excel, JSON, XML, and DBF. Files with data can be external and embedded to report template. Don’t forget that in this case, report file size will be increased by the size of a data file.Any external file with data can be embedded to report resources. Read about how to do this here.
On our YouTube channel, we have put together a large playlist of video tutorials about working with data.
In the next article, we will tell you how to create a dashboard in the report designer. If you have any questions about data connection, creating data sources, or creating connections, you should contact us or refer to our documentation for help.