We are happy to announce the release of the new version 2011.3 of our Stimulsoft Report product line. It was two months of very tough time. During this period we prepared multiple innovations for you to make your development easier and faster. The enhancements and updates elaborately described in this article.
New WebViewer Component
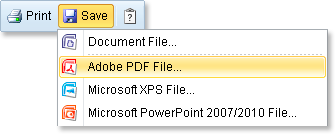
The WebViewer component has been updated so that was actually new. It has been completely rewritten from the brand new menu, and ending with supporting for themes. The new WebViewer was fully tested on all browsers and mobile platforms.
New Functions
We have added two new functions. These are ToWordsPt and ToCurrencyWordsPt. The ToWordsPt function converts the number to the value in words in Portuguese. The ToCurrencyWordsPt function converts the number to the value words specifying the currency.

Interactive Selection
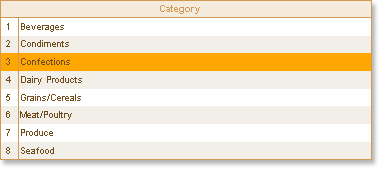
The functionality of the Interaction property has been expanded in the new version. The Data Band has now the SelectionEnabled property. This property allows you to select a row in the data band in the report preview. It allows you to build dynamic master-detail reports with an unlimited nesting. See the examples in the DEMO application.
Cross-Tab in Silverlight
The new version offers support for the Cross-Tab component in Silverlight. Full compatibility in the Report Designer, in its engine - all report data are quickly and easily handled. Using the report generator in Silverlight environment has become more convenient.
Conditions in Series Labels
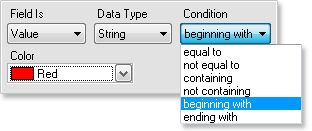
Now you can add Conditions to Series Labels of the Chart component. With the new conditions you can affect the formatting of chart labels. This gives you an unlimited ability of formatting and attracting users' attention to design charts.
Quick Button for Image
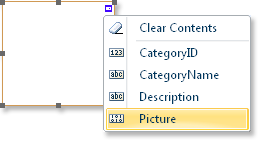
To speed up work with the Image components, we have added to it the Quick Button. This Quick Button allows you to quickly select the data column from which images will be taken for the component.
Importing Tools Improved
Since the last release we have been revised all importing utilities and dramatically improved their performance. Much work has been done over the import utility for Active Reports, Crystal Reports, and Microsoft Reporting Services. We believe that the new importing tools will accelerate the converting reports process from these products. The latest versions of the tools can be found in the section Downloads -> Importing Tools of our site.
Printing via HTML
There is an opportunity in the product to print using HTML for the WebViewerFx component of the product Reports.Web and Reports.Ultimate. Print via HTML by means of a browser, and the fonts are printed in a vector format, allowing to get rid of a large amount of data and text blurring. It should be borne in mind that when you print using HTML the browser settings are used.
Improved Globalization Editor
The new version of the Globalization Editor adds two new functions "Get culture" and "Set culture." The "Get culture" function allows you to fill in the current culture of the report with values from the report. The "Set culture" function allows you to apply a customized culture directly into the current account during the report designing.

Multilingual Report Checker
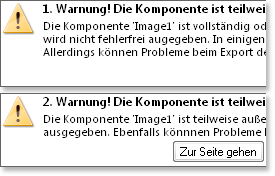
Properties description and the report checker is now localized in German in Silverlight, WPF and NET products. The properties description and the report checker is now localized in Russian in Silverlight. The utility Report Checker now generates messages in German. What makes our German-speaking users be able to get, with great pleasure and comfort, error messages and ways of solving them in German. In addition, the utility in the Silverlight platform knows three languages and is able to produce detailed messages, suggestions to change a report in English, Russian and German.
Interaction in Silverlight
The report engine for the Silverlight platform in the Net mode does not support the Interaction property. Starting with the new version we have added full support for this property. We hope that this innovation will make your report more user-friendly.
Print in Silverlight
In recent years, many changes were made to fix a printing method. Since the release of 2011.2 we fixed a problem with truncation of the right side of the page, also fixed some problems with printing primitives. Also, according to users' requests, the Print method was moved to the StiReport class and, to print a report, you do not need to always make it be displayed in the viewer and waste extra resources, simply call the Print method.
Expressions in Chart Filters
In the new version of the report generator you may specify complex filtering for each series of the Chart component. You can now use the expression in the chart filters. Also filtering by fields that are not in the chart and also by related fields, but not only by an argument or a value, as it was previously, became available.
Borders, Locations and Styles
The AllowUserBorderSidesFromLocation property is added to the report style. If it is set to true, then depending on the location of the component in the band with a style set, the displayed border of this component is changed. For example, if it is located in the upper left corner of the band, then, accordingly, it sets the left and the upper border. If it is put in the center and does not border any of the band edges, the boundaries of the component are reset. If it is located on the bottom edge, then the lower border is set. If the component takes the entire band space, then it outlines all four borders. This feature allows you to build very complex styles that allow you to avoid unnecessary complication of the report.
Business Objects in Wizards
All report wizards now support for Business Objects. Previously, it was possible to select only the Data Source. The emergence of such a feature allows you to use Business Objects fully and equally with the Data Sources.

Business Objects in Silverlight
The newest version of the Silverlight reporting tool supports Business Objects filtering and sorting. It is now possible to create reports using not only the Data Source but also Business Objects.
WebViewer and Parameters
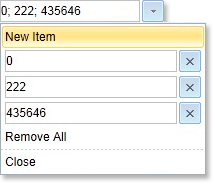
The StiWebViewer component now has a new panel of variables for the query parameters from the user. It has a user-friendly interface that allows the user to easily enter complex parameters such as lists, editable lists with changeable number of elements, ranges of data types. For the type "date" we created a comfortable DatePicker (calendar), whereby there is no need to enter the date manually. When sending data from a panel of variables or resetting them to the initial values, changes in the report are applied without reloading the page. Also, a new panel of variables is made in accordance with the new WebViewer design.
Hierarchical Reports and Business Objects
Business Objects now become available for the hierarchical band. Previously, Business Objects in a hierarchical band were not available. In the new version we worked on this shortcoming and removed it. Now, for any hierarchical band any Business Objects can be applied. This option allows you to make your reports more visually literate and comfortable to use. We further plan to add new features to our product.
New WebViewer Component
The WebViewer component has been updated so that was actually new. It has been completely rewritten from the brand new menu, and ending with supporting for themes. The new WebViewer was fully tested on all browsers and mobile platforms.

New Functions
We have added two new functions. These are ToWordsPt and ToCurrencyWordsPt. The ToWordsPt function converts the number to the value in words in Portuguese. The ToCurrencyWordsPt function converts the number to the value words specifying the currency.

Interactive Selection
The functionality of the Interaction property has been expanded in the new version. The Data Band has now the SelectionEnabled property. This property allows you to select a row in the data band in the report preview. It allows you to build dynamic master-detail reports with an unlimited nesting. See the examples in the DEMO application.

Cross-Tab in Silverlight
The new version offers support for the Cross-Tab component in Silverlight. Full compatibility in the Report Designer, in its engine - all report data are quickly and easily handled. Using the report generator in Silverlight environment has become more convenient.
Conditions in Series Labels
Now you can add Conditions to Series Labels of the Chart component. With the new conditions you can affect the formatting of chart labels. This gives you an unlimited ability of formatting and attracting users' attention to design charts.

Quick Button for Image
To speed up work with the Image components, we have added to it the Quick Button. This Quick Button allows you to quickly select the data column from which images will be taken for the component.

Importing Tools Improved
Since the last release we have been revised all importing utilities and dramatically improved their performance. Much work has been done over the import utility for Active Reports, Crystal Reports, and Microsoft Reporting Services. We believe that the new importing tools will accelerate the converting reports process from these products. The latest versions of the tools can be found in the section Downloads -> Importing Tools of our site.
Printing via HTML
There is an opportunity in the product to print using HTML for the WebViewerFx component of the product Reports.Web and Reports.Ultimate. Print via HTML by means of a browser, and the fonts are printed in a vector format, allowing to get rid of a large amount of data and text blurring. It should be borne in mind that when you print using HTML the browser settings are used.
Improved Globalization Editor
The new version of the Globalization Editor adds two new functions "Get culture" and "Set culture." The "Get culture" function allows you to fill in the current culture of the report with values from the report. The "Set culture" function allows you to apply a customized culture directly into the current account during the report designing.

Multilingual Report Checker
Properties description and the report checker is now localized in German in Silverlight, WPF and NET products. The properties description and the report checker is now localized in Russian in Silverlight. The utility Report Checker now generates messages in German. What makes our German-speaking users be able to get, with great pleasure and comfort, error messages and ways of solving them in German. In addition, the utility in the Silverlight platform knows three languages and is able to produce detailed messages, suggestions to change a report in English, Russian and German.

Interaction in Silverlight
The report engine for the Silverlight platform in the Net mode does not support the Interaction property. Starting with the new version we have added full support for this property. We hope that this innovation will make your report more user-friendly.
Print in Silverlight
In recent years, many changes were made to fix a printing method. Since the release of 2011.2 we fixed a problem with truncation of the right side of the page, also fixed some problems with printing primitives. Also, according to users' requests, the Print method was moved to the StiReport class and, to print a report, you do not need to always make it be displayed in the viewer and waste extra resources, simply call the Print method.
Expressions in Chart Filters
In the new version of the report generator you may specify complex filtering for each series of the Chart component. You can now use the expression in the chart filters. Also filtering by fields that are not in the chart and also by related fields, but not only by an argument or a value, as it was previously, became available.
Borders, Locations and Styles
The AllowUserBorderSidesFromLocation property is added to the report style. If it is set to true, then depending on the location of the component in the band with a style set, the displayed border of this component is changed. For example, if it is located in the upper left corner of the band, then, accordingly, it sets the left and the upper border. If it is put in the center and does not border any of the band edges, the boundaries of the component are reset. If it is located on the bottom edge, then the lower border is set. If the component takes the entire band space, then it outlines all four borders. This feature allows you to build very complex styles that allow you to avoid unnecessary complication of the report.
Business Objects in Wizards
All report wizards now support for Business Objects. Previously, it was possible to select only the Data Source. The emergence of such a feature allows you to use Business Objects fully and equally with the Data Sources.

Business Objects in Silverlight
The newest version of the Silverlight reporting tool supports Business Objects filtering and sorting. It is now possible to create reports using not only the Data Source but also Business Objects.
WebViewer and Parameters
The StiWebViewer component now has a new panel of variables for the query parameters from the user. It has a user-friendly interface that allows the user to easily enter complex parameters such as lists, editable lists with changeable number of elements, ranges of data types. For the type "date" we created a comfortable DatePicker (calendar), whereby there is no need to enter the date manually. When sending data from a panel of variables or resetting them to the initial values, changes in the report are applied without reloading the page. Also, a new panel of variables is made in accordance with the new WebViewer design.

Hierarchical Reports and Business Objects
Business Objects now become available for the hierarchical band. Previously, Business Objects in a hierarchical band were not available. In the new version we worked on this shortcoming and removed it. Now, for any hierarchical band any Business Objects can be applied. This option allows you to make your reports more visually literate and comfortable to use. We further plan to add new features to our product.