We are pleased to announce the release of the new version Stimulsoft Reports 2016.2 which is now available for download. With this new version we introduce new features which are the rethought web viewer, globalization editor in the web designer, support for ZUGFeRD great many improvements in Stimulsoft Reports.JS, and many more.
Report Checker in Reports.Web and Reports.JS
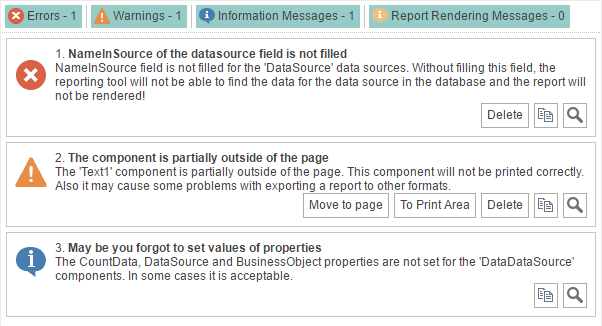
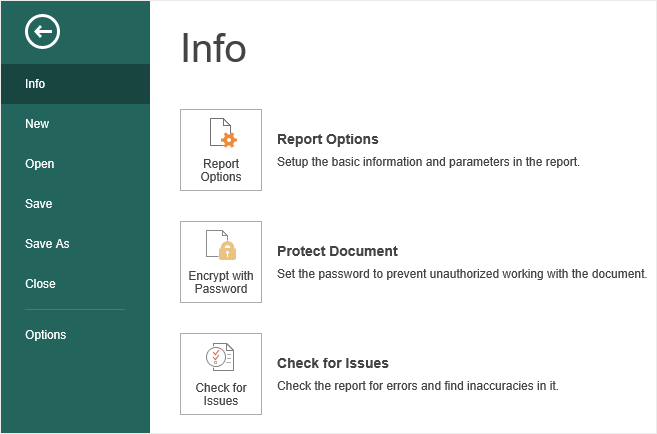
Now, in the HTML5 Report Designer, you can check the report for errors. Also, you can get a variety of recommendations to improve the report. To do so, click the Check for Issues command in the menu File -> Info or run the report for rendering from the report designer.
Report Encryption in Reports.Web and Reports.JS
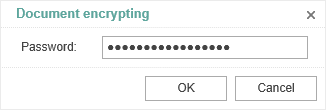
Now the report can be password protected. To do this in the Report Designer, click the Protect Document command in the menu File -> Info and specify a password. After that, when you click Save, the report is packed and encrypted. To open it, you will need to type a password.
It is worth noting that this feature is present in the earlier versions of the .NET product line.
Retrieve Only Used Data
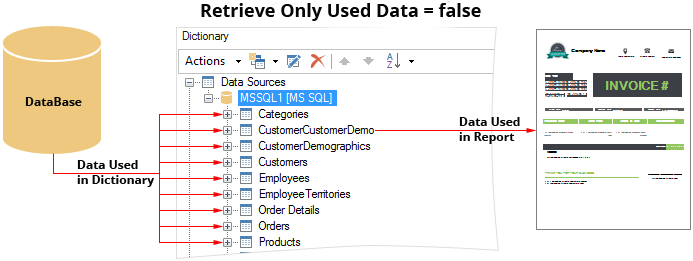
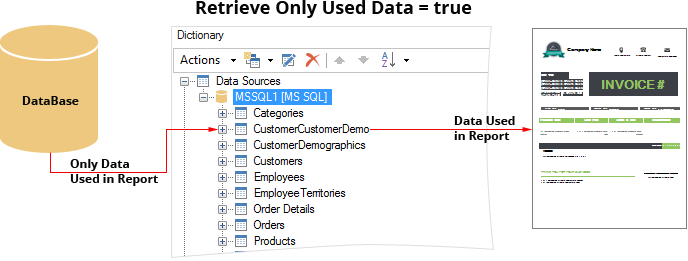
In the release of 2016.2, the reporting tool can request only the data needed for the report. To do this, you should change only one value of the Retrieve Only Used Data property to true, and then when rendering the report, data sources will be filled with the data that are used in the report.
Rethought Web Viewer
Our team has made complete refactoring of components WebViewer, MobileViewer, and MvcViewer. As a result, we have completely updated the component to view reports - WebViewer. Now, this component is a universal full-featured tool for viewing reports. At the same time, the WebViewer component has a number of advantages over the older versions. Increased speed of report processing and improved with cache, optimized work with large reports (big reports). WebViewer is developed using HTML5 and CSS3 technologies and supported in any browser. Also, this component is adapted for mobile devices.
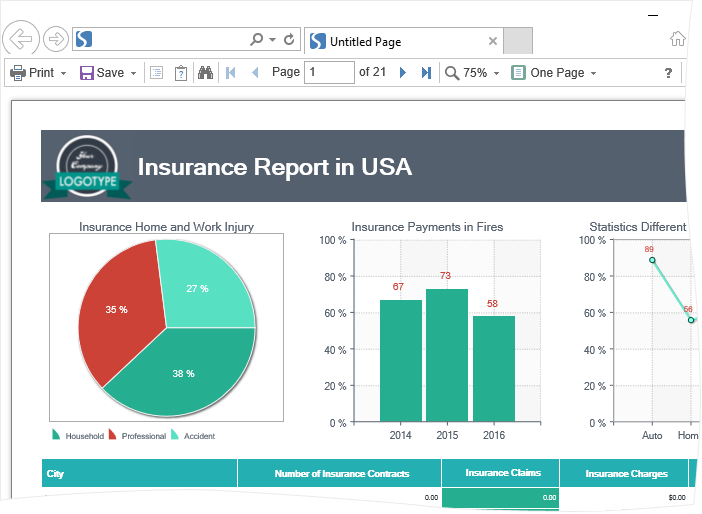
Updated WebViewerFx in Reports.Web
In the release of 2016.2, updated WebViewerFx is now located in the Stimulsoft.Reports.Web assembly. This report viewer is based on the Flash technology and requires the installation of Flash Player. The updated component has standardized event names and properties, implemented general report processing algorithms with Web Viewer. Report caching algorithms was also updated. Static parameters pass dynamic properties of the component. The old version of WebViewerFx is located in the Stimulsoft.Reports.WebFx assembly, works in the compatibility mode, and is outdated.
The Query Timeout Parameter
In the menu of creating a query to the data store you can determine the query timeout. Previously, access to this option was possible from the Property Panel from code. Now you only need to specify the time after which an error message of the query timeout will be thrown. The value is set in seconds. By default, the query execution time of 30 seconds.
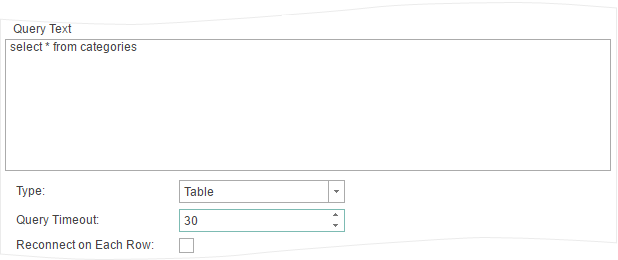
This property is not available in Reports.Java from the create query menu.
Embedded Files When Exporting to PDF
We added the ability to export a report to PDF and embed other files in this document. This may be different files. For example, data files such as XML or CSV and others. In particular, Excel files can also be embedded. Embedding files in a PDF document provides an opportunity to use modern standards when exporting reports.
Supports for ZUGFeRD
In our products for the .NET Framework, you can export reports to PDF by the ZUGFeRD standard. This standard is designed for electronic invoices. At the same time, the report will be converted to the PDF specification PDF/A-3, and an XML file with the invoice data will be embedded into the PDF document. More information can be found here.
Expressions in Watermark
A watermark in the report can now be the result of the expression.
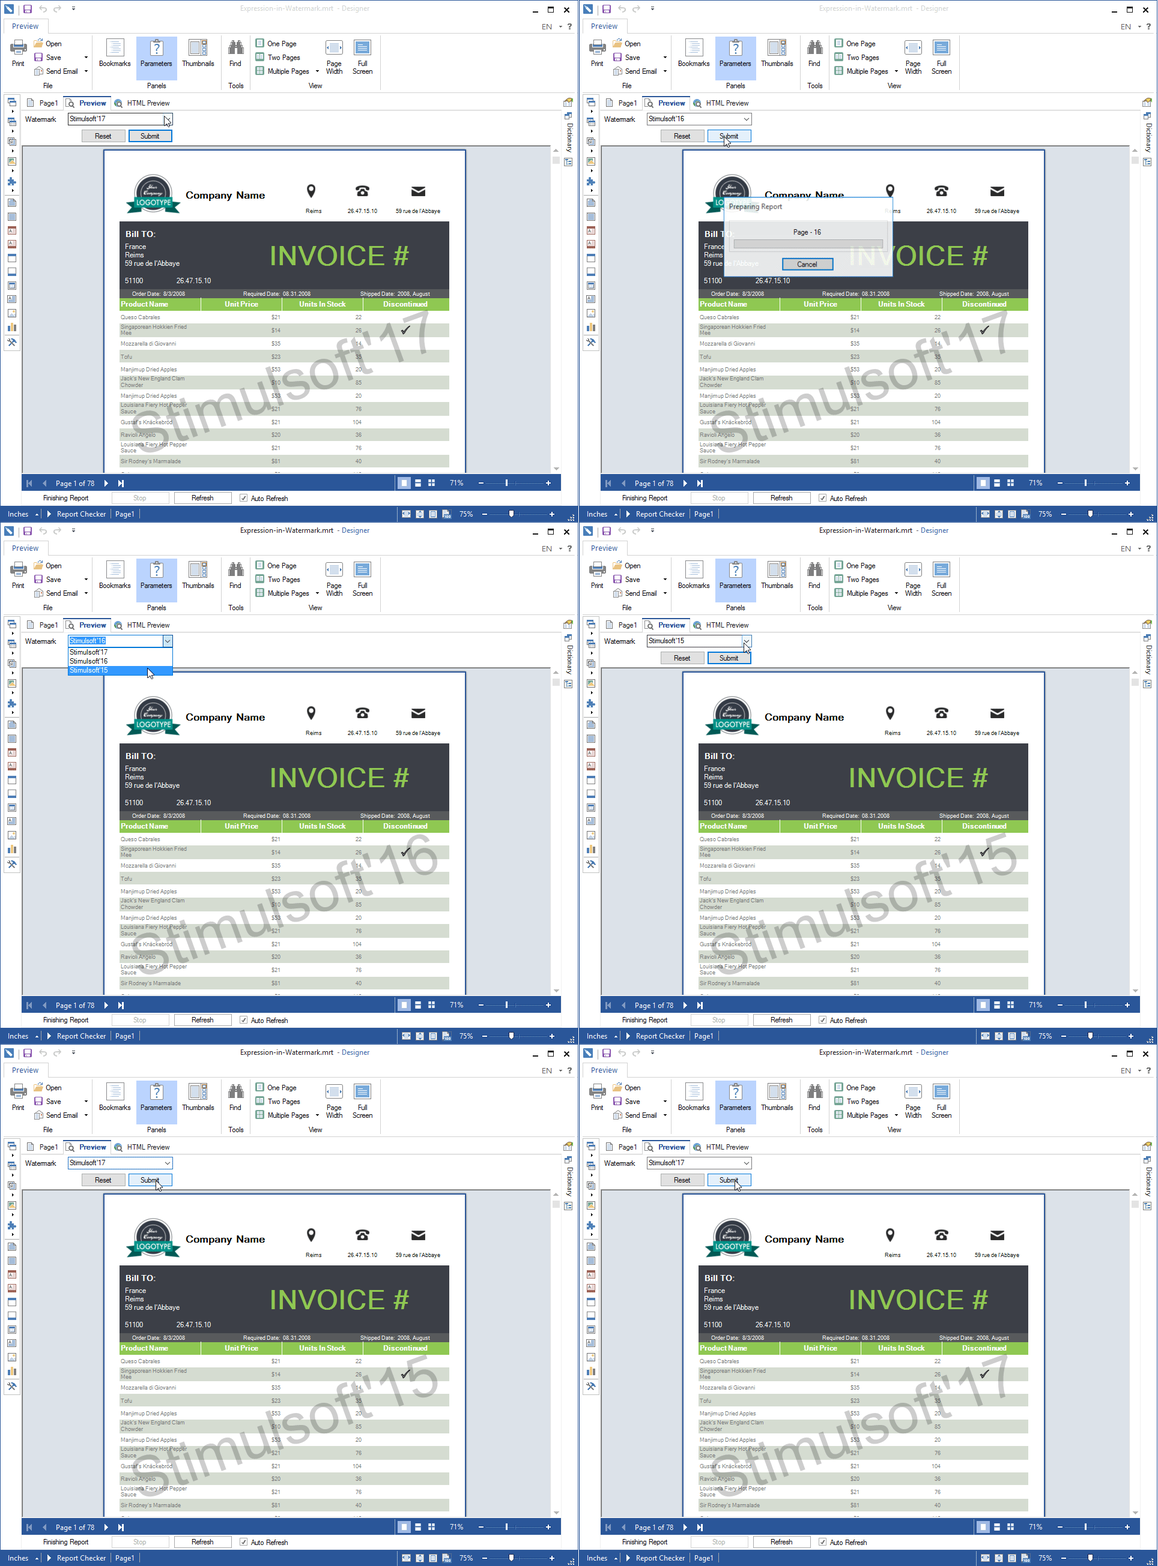
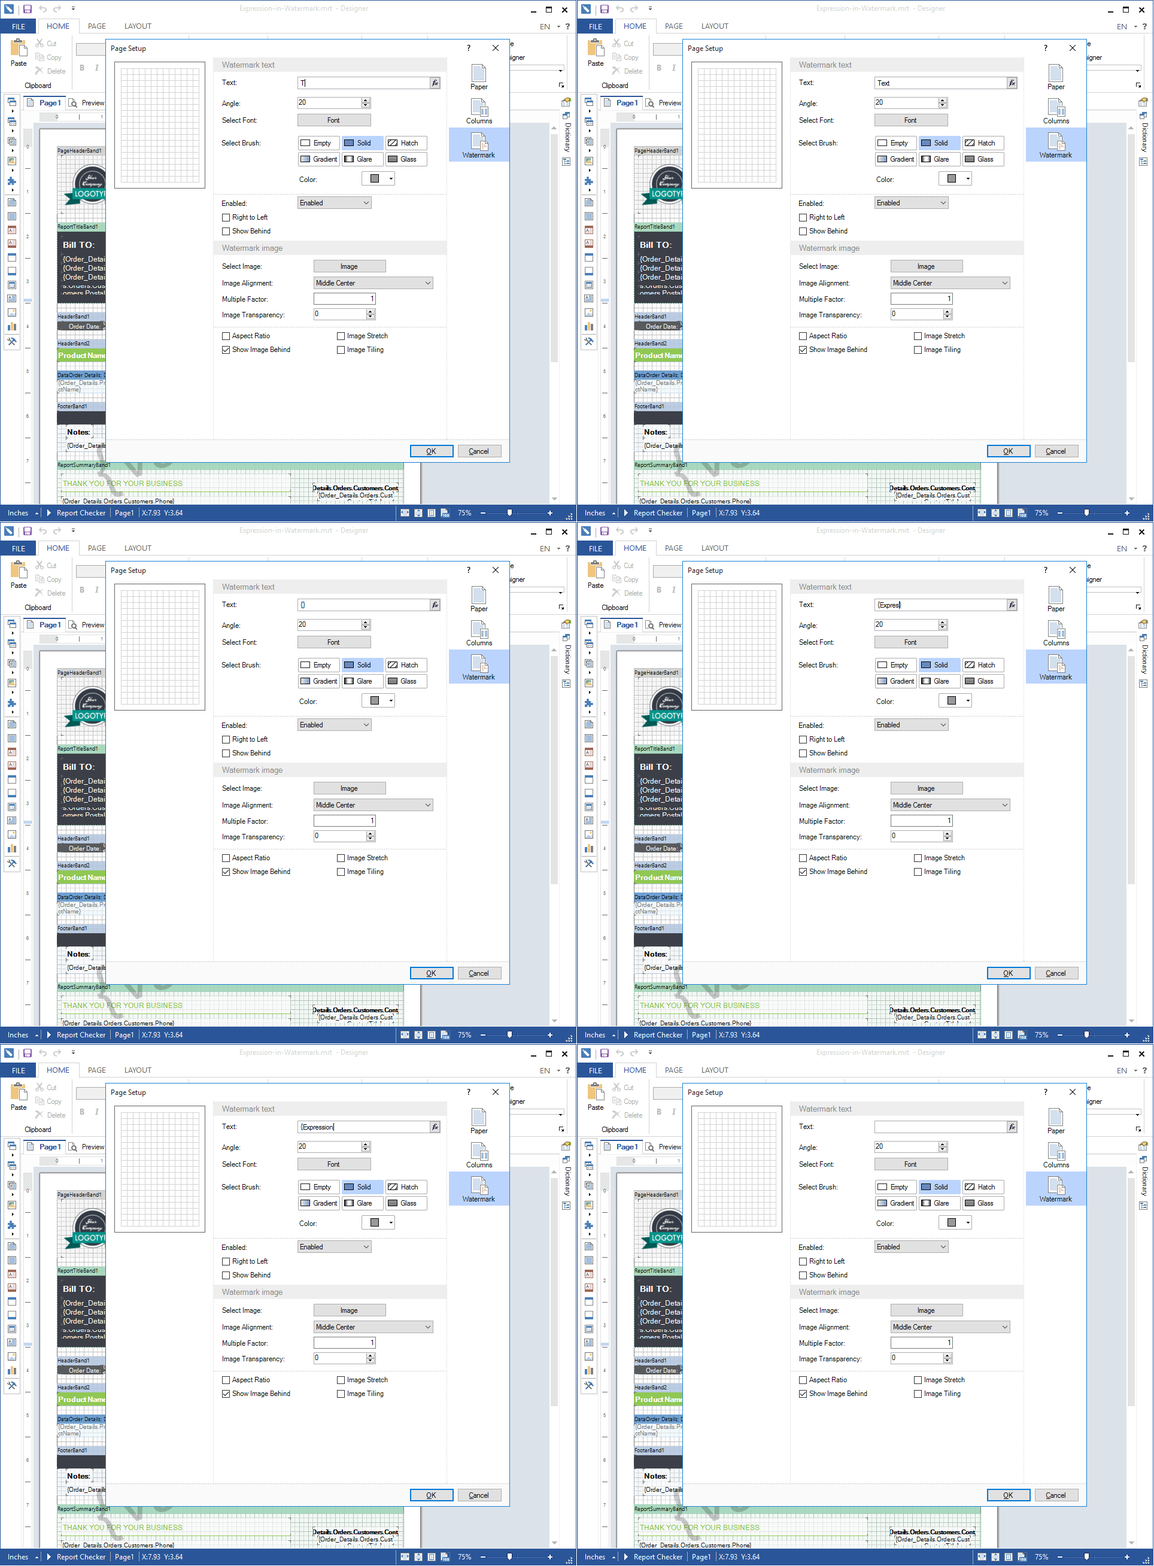
To do this, in the text field of the watermark, put an expression, for example {25+135/25}, and then, after the report is rendered, the result of this expression will be a watermark in the report. You can also specify an expression with the variable name, and then the watermark will be a selected value of this variable.
This option is not available in Reports.Java.
Enabling/Disabling Watermark by Condition
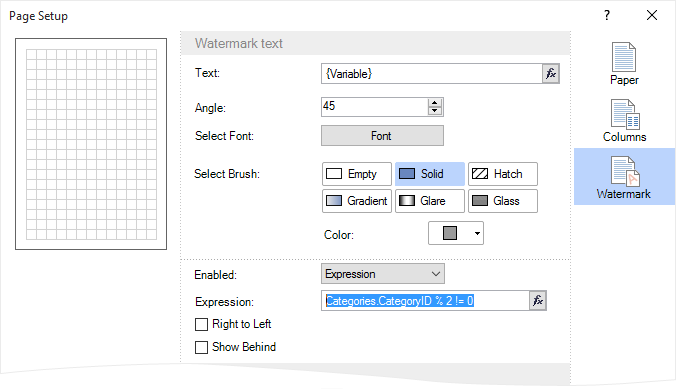
The watermark can be included in the report under certain conditions. The condition is defined by the expression in the Enabled field of the watermark.
This feature is available in Reports.Web, Reports.JS, Reports.Net, Reports.Wpf.
All Values of the Variable in Reports.Web and Reports.Java
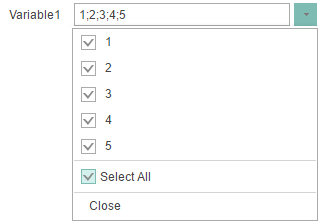
When using a variable of list type in a report, you can simultaneously select multiple values. In the 2016.2 release, we added a button to select all values of the variable. To do this, just check the Select All. If you want to deselect all of the values, you should uncheck it.
Improved Calendar in the Variable
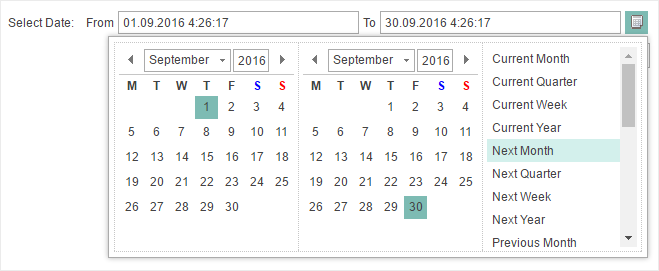
When using a variable of the Date Range type in a report in Reports.Web and Reports.JS, new values are added to the calendar. Now you can select not only a specific range of dates but relative values as well.
Updated Style Designer
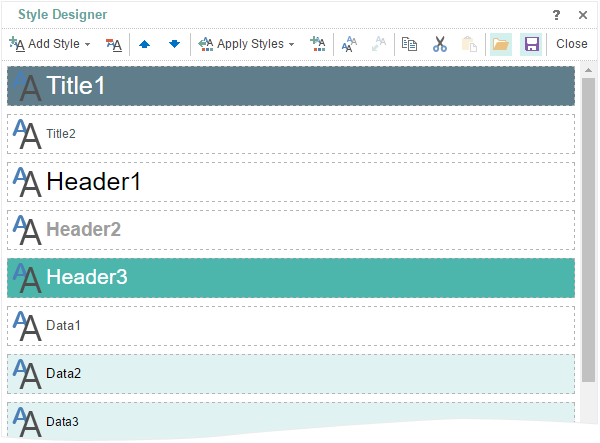
The Style Designer was significantly improved in Reports.Web and Reports.JS. Commands for working with the clipboard were added. The commands to save styles and collections to a file and load them from a file. Also, the add style menu was redesigned.
An example of creating styles and collections can be found here.
Conditions in Styles in Reports.Web
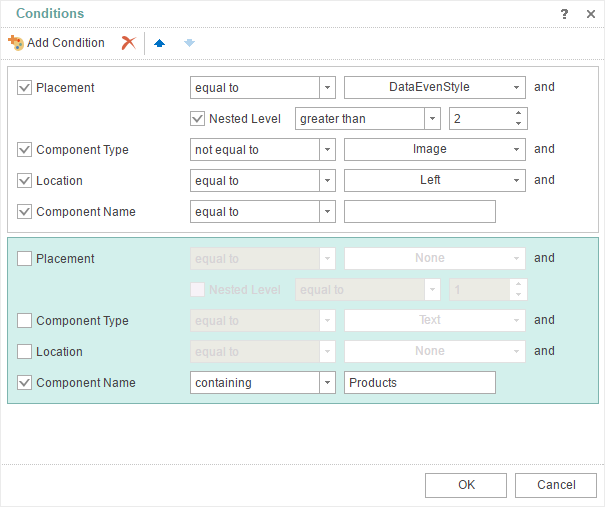
When you create styles in Reports.Web, now you have the opportunity to set when to apply this style to the component. Conditions can be set depending on the location, type, location or name of the component to which this style will be applied. The number of conditions in the same style is unlimited.
Report Tree in HTML5 Designer
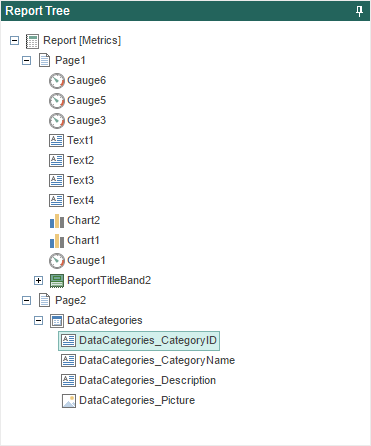
The Report tree panel is added in the Report Designer. This panel visually displays the hierarchy of the components of the report. When rendering a report, the report components are handled subsequently and in order to determine which component will be processed before, it is sufficient to look at the report tree. The higher is a component in the tree, the higher is the priority for processing.
The feature is added in Reports.Web and Reports.JS.
Mirror Fields in Reports.Web and Reports.JS
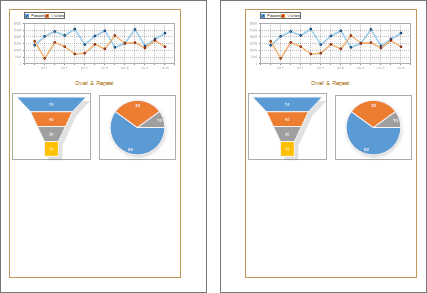
Now you can create reports with binding like in books. In the current release we added support for the mirror fields. To activate the mirror fields, you need to select the Mirror Margins parameter in the page properties.
The New Item in the File Menu in Reports.Web and Reports.JS
We have added a new Info item info the File menu. This section contains the main opportunities to work with the report.
Report Globalization in Reports.Web
From the release 2016.2 we have added the globalization feature into the web designer. The report designer has a Globalization Editor. This editor allows you to localize a report into multiple languages. When rendering a report, the reporting tool will check the culture of the installed operating system. After checking the culture in the installed OS, the reporting tool will check the availability of the same culture in the list of cultures available in the report. And, if the matching culture is found, there will be a substitution of all expressions in the report. As a result, the report will be localized into the culture of your operating system, according to certain parameters in the Globalization Editor. If the culture of the operating system is not present in the list of report cultures, then the report will not be localized when rendering. If the button Auto Localize Report on Run is not disabled then automatic localization will not be applied.
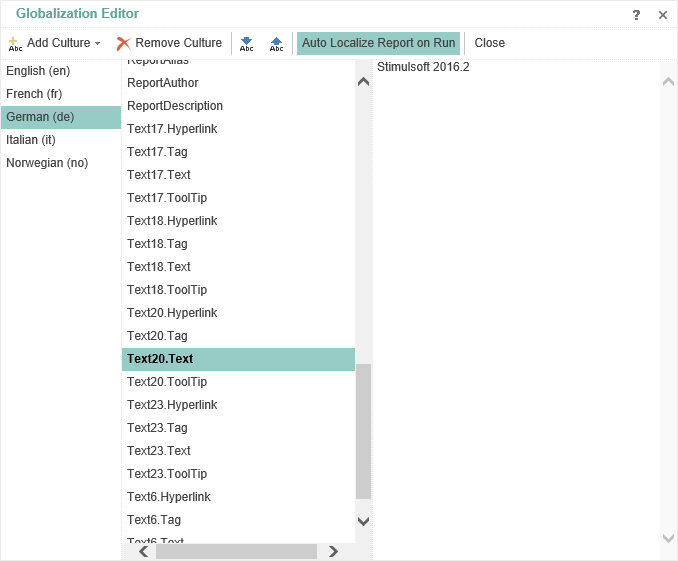
In order to open the Globalization Editor you should click the ... button in the Globalization Strings property.
Copying Components with the Ctrl Key in Reports.Web and Reports.JS
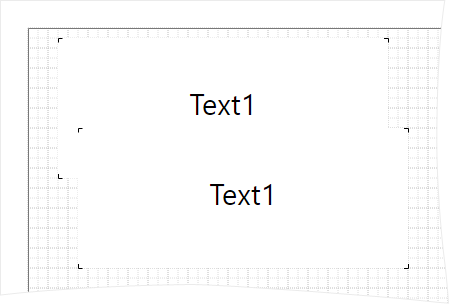
One of the ways to copy components is a method of using the Ctrl key. To do this, select the component, hold down the Ctrl key and hold it, pull the component with the cursor. The component itself and all other components placed on it will be copied.
Report Culture in Reports.Web and Reports.JS
In the release of 2016.2, in the Web report designer, you can change the culture for the report. Many report elements depend on the selected culture. Localization of system variables in the designer and in the viewer, the date and time formatting and many more.
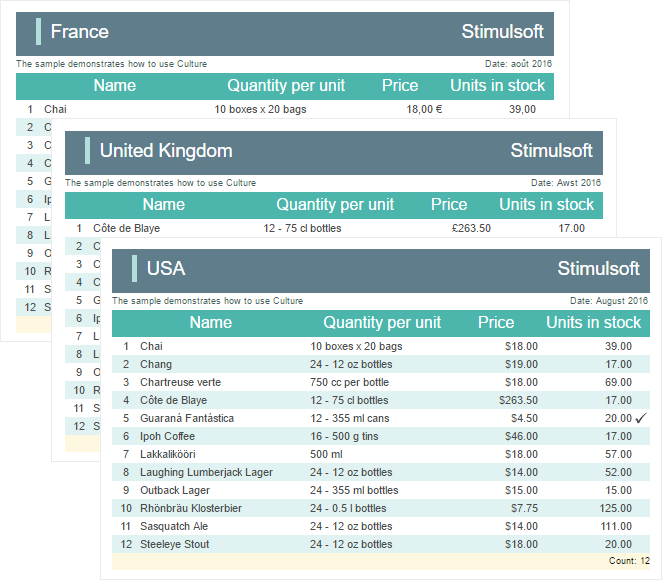
Read more about the culture here.
Interactive Sorting in Reports.JS
We have added the ability to use interactive sorting in reports. To add interactive sorting, you should select the component and press the Interaction button on the property panel. Interactive sorting involves the ability to sort the data in the viewer. By clicking on the components with enabled sorting, you can change the order of data output during the report creation process.
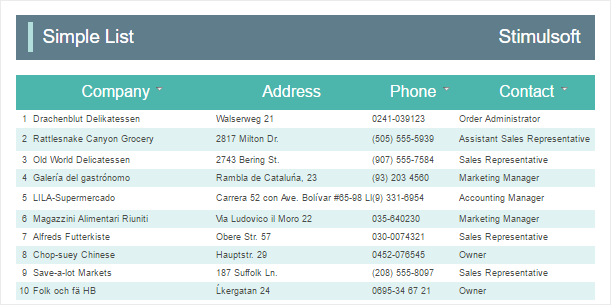
Read more about this here.
Collapsing in Reports.JS
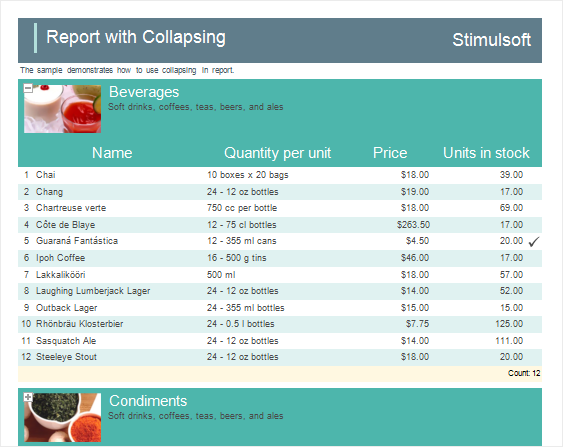
The 2016.2 release adds the ability to use dynamic collapsing in reports. Using this feature, you can expand and collapse lists and groups in the viewer window. To add a dynamic collapsing, select the Group Header band and press the Interaction button on the property panel. For example, there is a report with groups, and dynamic collapsing is enabled for group headers. In this case, by pressing the group header, it will collapse or expand, depending on the initial state.
Read more about this here.
Drill-Down Reports in Reports.JS
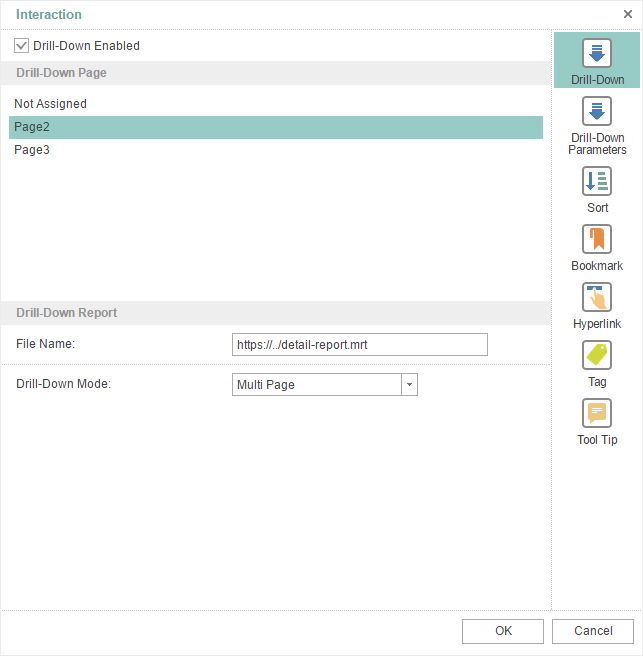
In the release of 2016.2, in Reports.JS, you can create interactive reports with drill-down. Detailed data may be located in the report with the master data on another report template page, and can be located in an external report.
Read more about this here.
Virtual Data Source in Reports.JS and Reports.Java
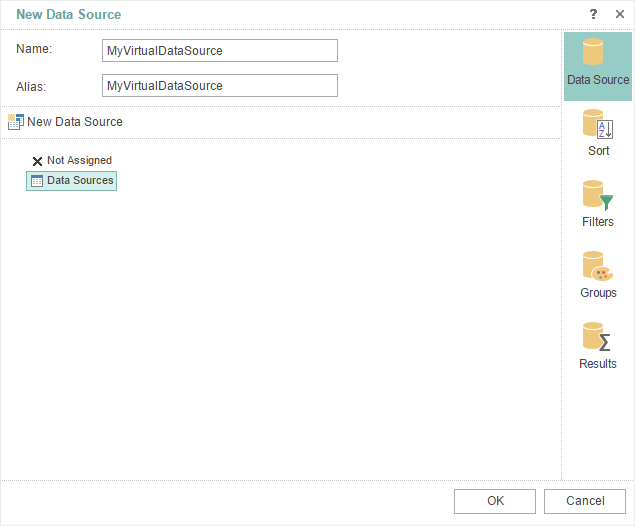
We added the ability to create a virtual data source, the data from other data sources. This is true when the data, from the storage, is not possible to be filtered, sorted, grouped, or it is impossible apply the function to calculate the result using a query. In this case, you can create a virtual data source and on its basis to build a report in the Report Designer.
Adapters of Data Sources in Java
In the current release of Reports.JS we added support for database adapters in Java for the server side. Currently the following adapters are supported - Firebird, MySQL, Oracle, PostgreSQL, MS SQL.
Oracle Data Source in Reports.JS, Reports.Java, and Reports.PHP
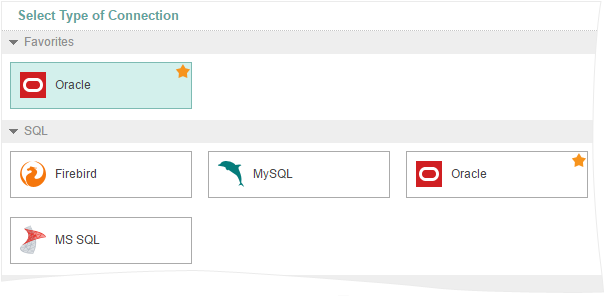
Since release 2016.2, we added the Oracle adapter. Now it is possible to generate reports on the basis of the Oracle data source.
Export to Excel in Reports.JS
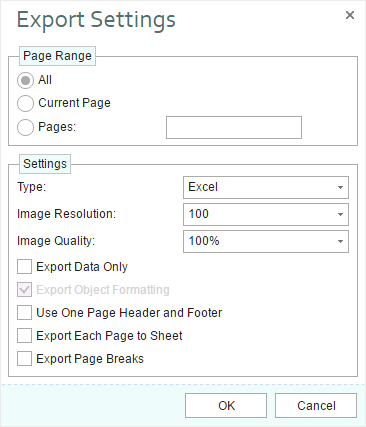
We added the new export of reports to Microsoft Excel. The report will be converted to the *.xlsx file.
Export to CSV in Reports.JS
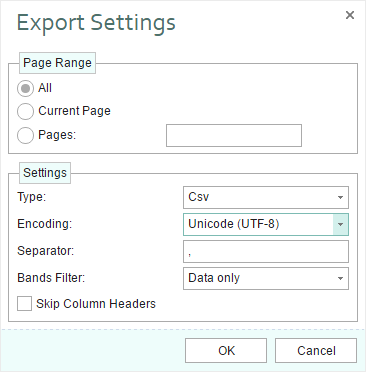
This is another new export in Reports.JS. Now reports can be converted to a CSV file. You can specify the required encoding, data separator, and choose the report items that need to be converted.
Charts and Barcode When Exporting a Report to PDF
In this release, we have finalized export of reports to PDF in Reports.JS. Now reports can be converted with components such as charts and barcode.
Cross-tab Editor in Reports.Java and Reports.JS
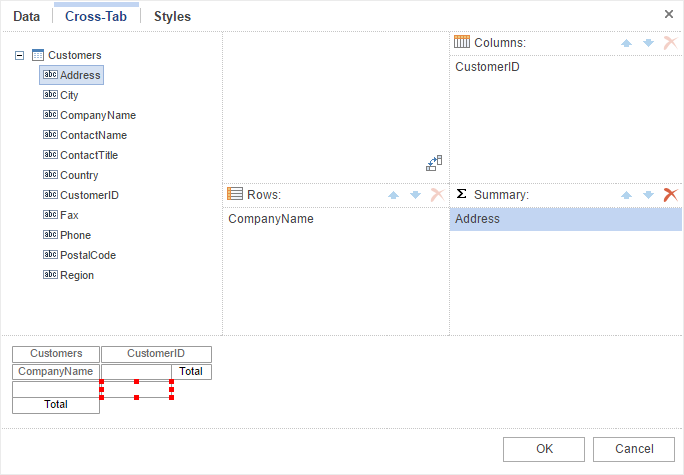
The 2016.2 release now has the cross-tab editor in the report designer. Now you can not only to view reports with the cross-tab component but also to create them. The editor contains three tabs – the first one indicates the data source, the second tab indicates rows, columns, and total cells, and the third one indicates a style of a cross-tab.
Histogram Conditions in Reports.JS
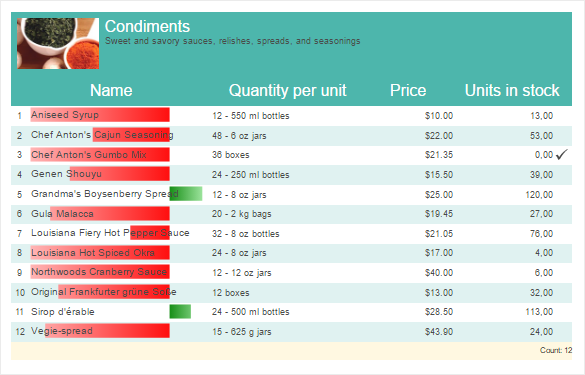
Histogram Conditions in the reporting tool in JavaScript, provides an opportunity to visually display the dynamics of changes in the values of these columns. This condition may be displayed as positive values and negative.
Conditions in the Color Scale in Reports.JS
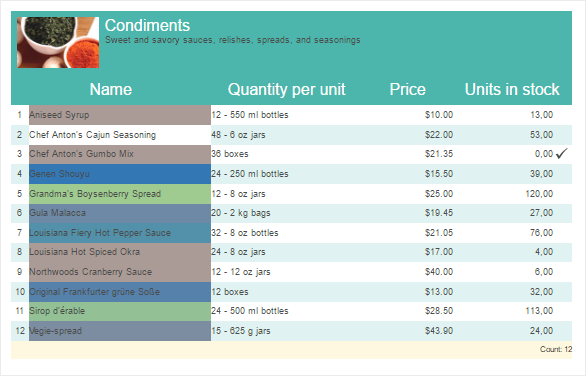
The Color Scale condition provides an opportunity to highlight the color of the components depending on its value. When you create the conditions determined by the base color for the minimum, average and maximum values of the data column. Depending on the column value (the value is closer to the minimum, average or maximum), this or that shade is applied.
Icon Set Condition in Reports.JS
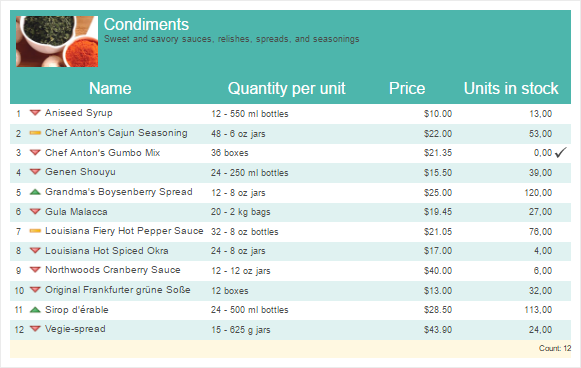
Now it is possible to highlight a component with an icon depending on the value. To do this, add a condition icons set, specify the column with the values and set an icon style.
The Direction in Columns and the Minimum Number of Rows
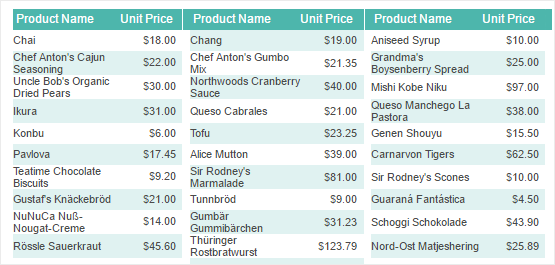
In the release of 2016.2, in Reports.Web and Reports.JS, reports with columns on the Data band may have the direction of columns and the minimum number of entries in the columns. There are two directions – from Down to Right and from Right to Down. By default, the selected direction is from Right to Down. The property of the minimum number of entries is determined by the minimum number of column lines column which must be filled before you start filling the next column. By default, entries in columns are evenly distributed.
The Events Tab in Reports.JS
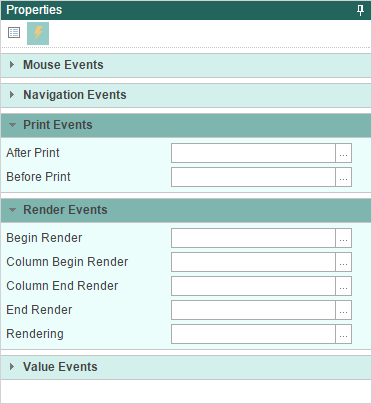
In the Properties Panel of the report designer we have added the Events tab, which contains a list of report events of the selected component. For example, if you want some action be executed immediately after the rendering of the text component, you should sign up for the End Render event of the text component.
Support for the Table component in Reports.Java and Reports.Web
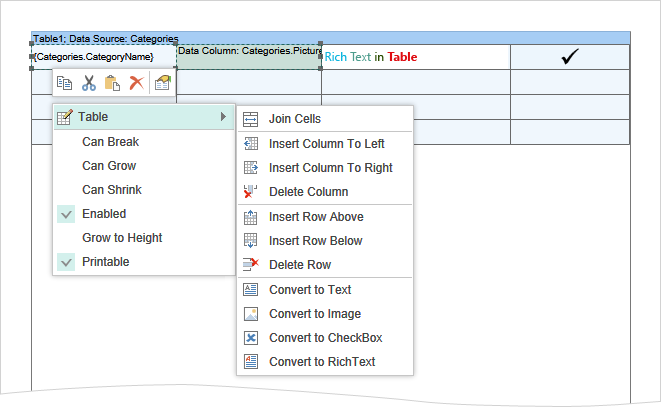
The table consists of cells which are formed at the intersection of rows and columns. These cells contain various data such as text, expressions, reference to data columns, RichText, image, checkbox.
Grid in Reports.Java
This release adds the ability to display a grid on the page. The grid is used for accurate alignment of the components relative to each other. For example, you can use the Snap to Grid command, to bind the components of the report to the nodes of the grid. The grid may look like dots and lines. Enabling the Grid can be done in the Options dialog.

Styles by Dragging the Data Source
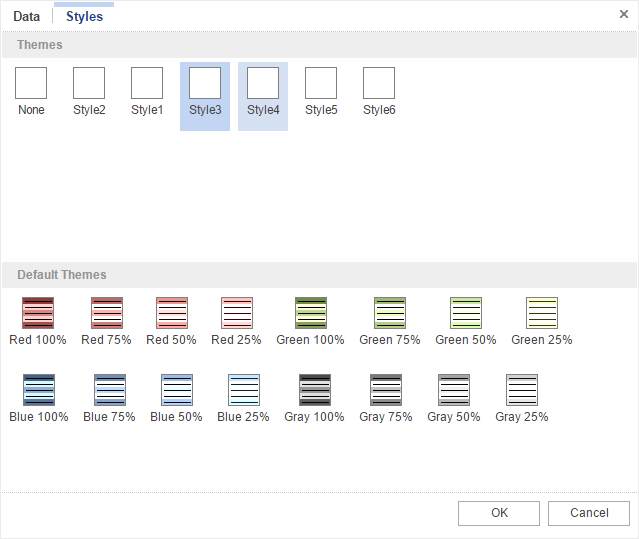
In this release, the web designer in Reports.Java has the ability to define a style of the report when creating its structure. When you drag a data source to the report template, the Data menu is called. In this menu you can select a data column and identify other options. Now the menu has Styles tab. This tab provides predefined styles and custom collection of styles. Choose a style, and it will be immediately applied to create reports.
Text Formatting in Reports.Java
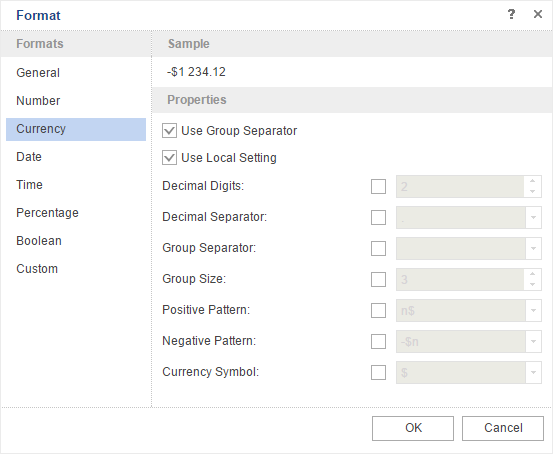
Since the release 2016.2, a variety of formats is available for text. You can set up a simple, numerical, currency, date or time format, percent, Boolean or set a custom format.
Calculated Data Column in Reports.Java
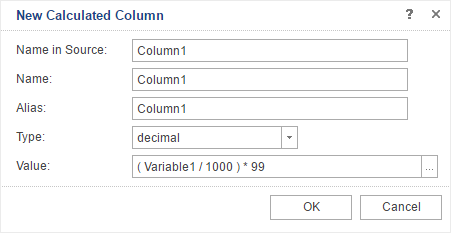
Now, you can use the calculated data column in reports. This column is created in the data dictionary. The value may be specified as an expression, in particular, and with reference to other elements of the data dictionary such as data column, variables, etc.
The Range of Dates in Reports.Java
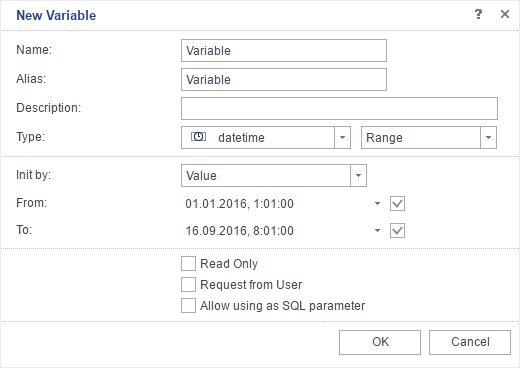
We have added the date range variable. When you use a variable in a report, you can specify not only a specific date but a specific range. You can create reports that will display information for a specific time period.
Compatibility with Java Server Faces
In this release we also added support for Java Server Faces. Our product Reports.Java is fully compatible with Java Server Faces (from the version 2.2).
Break if True in Reports.Java
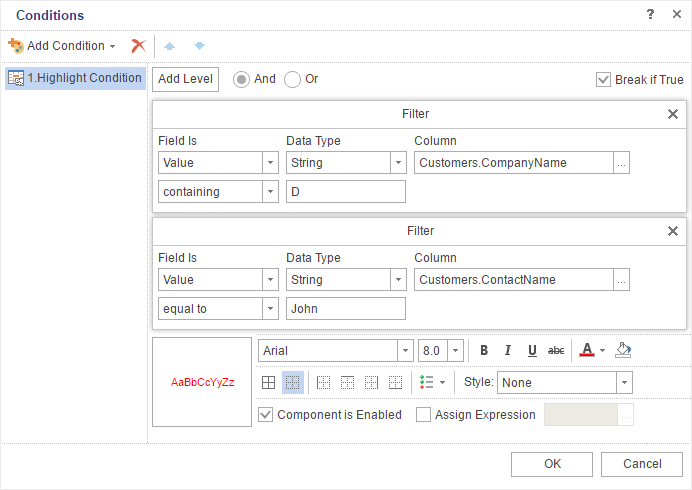
When using multi-level conditions in a report you can break the processing of report conditions. By default, all the conditions are processed sequentially until the last level. In the release of 2016.2, we added the Break if True option. If this option is enabled and the condition of any level is processed, i.e., returns the true value, then there is a break and other conditions, located below, will not be processed. If the option is disabled, then all levels of the condition are processed sequentially.
Styles for Charts in Reports.Java
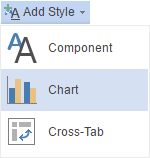
Now you can create styles for the charts. This provides an opportunity to significantly increase the attractiveness of your reports with charts and make them look better.
MS SQL Data Source in Reports.Java
Now you can create a MS SQL data source and generate reports based on this source.
Report Checker in Reports.Web and Reports.JS
Now, in the HTML5 Report Designer, you can check the report for errors. Also, you can get a variety of recommendations to improve the report. To do so, click the Check for Issues command in the menu File -> Info or run the report for rendering from the report designer.

Report Encryption in Reports.Web and Reports.JS
Now the report can be password protected. To do this in the Report Designer, click the Protect Document command in the menu File -> Info and specify a password. After that, when you click Save, the report is packed and encrypted. To open it, you will need to type a password.

It is worth noting that this feature is present in the earlier versions of the .NET product line.
Retrieve Only Used Data
In the release of 2016.2, the reporting tool can request only the data needed for the report. To do this, you should change only one value of the Retrieve Only Used Data property to true, and then when rendering the report, data sources will be filled with the data that are used in the report.


Rethought Web Viewer
Our team has made complete refactoring of components WebViewer, MobileViewer, and MvcViewer. As a result, we have completely updated the component to view reports - WebViewer. Now, this component is a universal full-featured tool for viewing reports. At the same time, the WebViewer component has a number of advantages over the older versions. Increased speed of report processing and improved with cache, optimized work with large reports (big reports). WebViewer is developed using HTML5 and CSS3 technologies and supported in any browser. Also, this component is adapted for mobile devices.

Updated WebViewerFx in Reports.Web
In the release of 2016.2, updated WebViewerFx is now located in the Stimulsoft.Reports.Web assembly. This report viewer is based on the Flash technology and requires the installation of Flash Player. The updated component has standardized event names and properties, implemented general report processing algorithms with Web Viewer. Report caching algorithms was also updated. Static parameters pass dynamic properties of the component. The old version of WebViewerFx is located in the Stimulsoft.Reports.WebFx assembly, works in the compatibility mode, and is outdated.
The Query Timeout Parameter
In the menu of creating a query to the data store you can determine the query timeout. Previously, access to this option was possible from the Property Panel from code. Now you only need to specify the time after which an error message of the query timeout will be thrown. The value is set in seconds. By default, the query execution time of 30 seconds.

This property is not available in Reports.Java from the create query menu.
Embedded Files When Exporting to PDF
We added the ability to export a report to PDF and embed other files in this document. This may be different files. For example, data files such as XML or CSV and others. In particular, Excel files can also be embedded. Embedding files in a PDF document provides an opportunity to use modern standards when exporting reports.
Supports for ZUGFeRD
In our products for the .NET Framework, you can export reports to PDF by the ZUGFeRD standard. This standard is designed for electronic invoices. At the same time, the report will be converted to the PDF specification PDF/A-3, and an XML file with the invoice data will be embedded into the PDF document. More information can be found here.
Expressions in Watermark
A watermark in the report can now be the result of the expression.

To do this, in the text field of the watermark, put an expression, for example {25+135/25}, and then, after the report is rendered, the result of this expression will be a watermark in the report. You can also specify an expression with the variable name, and then the watermark will be a selected value of this variable.

This option is not available in Reports.Java.
Enabling/Disabling Watermark by Condition
The watermark can be included in the report under certain conditions. The condition is defined by the expression in the Enabled field of the watermark.

This feature is available in Reports.Web, Reports.JS, Reports.Net, Reports.Wpf.
All Values of the Variable in Reports.Web and Reports.Java
When using a variable of list type in a report, you can simultaneously select multiple values. In the 2016.2 release, we added a button to select all values of the variable. To do this, just check the Select All. If you want to deselect all of the values, you should uncheck it.

Improved Calendar in the Variable
When using a variable of the Date Range type in a report in Reports.Web and Reports.JS, new values are added to the calendar. Now you can select not only a specific range of dates but relative values as well.

Updated Style Designer
The Style Designer was significantly improved in Reports.Web and Reports.JS. Commands for working with the clipboard were added. The commands to save styles and collections to a file and load them from a file. Also, the add style menu was redesigned.

An example of creating styles and collections can be found here.
Conditions in Styles in Reports.Web
When you create styles in Reports.Web, now you have the opportunity to set when to apply this style to the component. Conditions can be set depending on the location, type, location or name of the component to which this style will be applied. The number of conditions in the same style is unlimited.

Report Tree in HTML5 Designer
The Report tree panel is added in the Report Designer. This panel visually displays the hierarchy of the components of the report. When rendering a report, the report components are handled subsequently and in order to determine which component will be processed before, it is sufficient to look at the report tree. The higher is a component in the tree, the higher is the priority for processing.

The feature is added in Reports.Web and Reports.JS.
Mirror Fields in Reports.Web and Reports.JS
Now you can create reports with binding like in books. In the current release we added support for the mirror fields. To activate the mirror fields, you need to select the Mirror Margins parameter in the page properties.

The New Item in the File Menu in Reports.Web and Reports.JS
We have added a new Info item info the File menu. This section contains the main opportunities to work with the report.

Report Globalization in Reports.Web
From the release 2016.2 we have added the globalization feature into the web designer. The report designer has a Globalization Editor. This editor allows you to localize a report into multiple languages. When rendering a report, the reporting tool will check the culture of the installed operating system. After checking the culture in the installed OS, the reporting tool will check the availability of the same culture in the list of cultures available in the report. And, if the matching culture is found, there will be a substitution of all expressions in the report. As a result, the report will be localized into the culture of your operating system, according to certain parameters in the Globalization Editor. If the culture of the operating system is not present in the list of report cultures, then the report will not be localized when rendering. If the button Auto Localize Report on Run is not disabled then automatic localization will not be applied.

In order to open the Globalization Editor you should click the ... button in the Globalization Strings property.
Copying Components with the Ctrl Key in Reports.Web and Reports.JS
One of the ways to copy components is a method of using the Ctrl key. To do this, select the component, hold down the Ctrl key and hold it, pull the component with the cursor. The component itself and all other components placed on it will be copied.

Report Culture in Reports.Web and Reports.JS
In the release of 2016.2, in the Web report designer, you can change the culture for the report. Many report elements depend on the selected culture. Localization of system variables in the designer and in the viewer, the date and time formatting and many more.

Read more about the culture here.
Interactive Sorting in Reports.JS
We have added the ability to use interactive sorting in reports. To add interactive sorting, you should select the component and press the Interaction button on the property panel. Interactive sorting involves the ability to sort the data in the viewer. By clicking on the components with enabled sorting, you can change the order of data output during the report creation process.

Read more about this here.
Collapsing in Reports.JS
The 2016.2 release adds the ability to use dynamic collapsing in reports. Using this feature, you can expand and collapse lists and groups in the viewer window. To add a dynamic collapsing, select the Group Header band and press the Interaction button on the property panel. For example, there is a report with groups, and dynamic collapsing is enabled for group headers. In this case, by pressing the group header, it will collapse or expand, depending on the initial state.

Read more about this here.
Drill-Down Reports in Reports.JS
In the release of 2016.2, in Reports.JS, you can create interactive reports with drill-down. Detailed data may be located in the report with the master data on another report template page, and can be located in an external report.

Read more about this here.
Virtual Data Source in Reports.JS and Reports.Java
We added the ability to create a virtual data source, the data from other data sources. This is true when the data, from the storage, is not possible to be filtered, sorted, grouped, or it is impossible apply the function to calculate the result using a query. In this case, you can create a virtual data source and on its basis to build a report in the Report Designer.

Adapters of Data Sources in Java
In the current release of Reports.JS we added support for database adapters in Java for the server side. Currently the following adapters are supported - Firebird, MySQL, Oracle, PostgreSQL, MS SQL.
Oracle Data Source in Reports.JS, Reports.Java, and Reports.PHP
Since release 2016.2, we added the Oracle adapter. Now it is possible to generate reports on the basis of the Oracle data source.

Export to Excel in Reports.JS
We added the new export of reports to Microsoft Excel. The report will be converted to the *.xlsx file.

Export to CSV in Reports.JS
This is another new export in Reports.JS. Now reports can be converted to a CSV file. You can specify the required encoding, data separator, and choose the report items that need to be converted.

Charts and Barcode When Exporting a Report to PDF
In this release, we have finalized export of reports to PDF in Reports.JS. Now reports can be converted with components such as charts and barcode.
Cross-tab Editor in Reports.Java and Reports.JS
The 2016.2 release now has the cross-tab editor in the report designer. Now you can not only to view reports with the cross-tab component but also to create them. The editor contains three tabs – the first one indicates the data source, the second tab indicates rows, columns, and total cells, and the third one indicates a style of a cross-tab.

Histogram Conditions in Reports.JS
Histogram Conditions in the reporting tool in JavaScript, provides an opportunity to visually display the dynamics of changes in the values of these columns. This condition may be displayed as positive values and negative.

Conditions in the Color Scale in Reports.JS
The Color Scale condition provides an opportunity to highlight the color of the components depending on its value. When you create the conditions determined by the base color for the minimum, average and maximum values of the data column. Depending on the column value (the value is closer to the minimum, average or maximum), this or that shade is applied.

Icon Set Condition in Reports.JS
Now it is possible to highlight a component with an icon depending on the value. To do this, add a condition icons set, specify the column with the values and set an icon style.
The Direction in Columns and the Minimum Number of Rows
In the release of 2016.2, in Reports.Web and Reports.JS, reports with columns on the Data band may have the direction of columns and the minimum number of entries in the columns. There are two directions – from Down to Right and from Right to Down. By default, the selected direction is from Right to Down. The property of the minimum number of entries is determined by the minimum number of column lines column which must be filled before you start filling the next column. By default, entries in columns are evenly distributed.

The Events Tab in Reports.JS
In the Properties Panel of the report designer we have added the Events tab, which contains a list of report events of the selected component. For example, if you want some action be executed immediately after the rendering of the text component, you should sign up for the End Render event of the text component.

Support for the Table component in Reports.Java and Reports.Web
The table consists of cells which are formed at the intersection of rows and columns. These cells contain various data such as text, expressions, reference to data columns, RichText, image, checkbox.

Grid in Reports.Java
This release adds the ability to display a grid on the page. The grid is used for accurate alignment of the components relative to each other. For example, you can use the Snap to Grid command, to bind the components of the report to the nodes of the grid. The grid may look like dots and lines. Enabling the Grid can be done in the Options dialog.

Styles by Dragging the Data Source
In this release, the web designer in Reports.Java has the ability to define a style of the report when creating its structure. When you drag a data source to the report template, the Data menu is called. In this menu you can select a data column and identify other options. Now the menu has Styles tab. This tab provides predefined styles and custom collection of styles. Choose a style, and it will be immediately applied to create reports.

Text Formatting in Reports.Java
Since the release 2016.2, a variety of formats is available for text. You can set up a simple, numerical, currency, date or time format, percent, Boolean or set a custom format.

Calculated Data Column in Reports.Java
Now, you can use the calculated data column in reports. This column is created in the data dictionary. The value may be specified as an expression, in particular, and with reference to other elements of the data dictionary such as data column, variables, etc.

The Range of Dates in Reports.Java
We have added the date range variable. When you use a variable in a report, you can specify not only a specific date but a specific range. You can create reports that will display information for a specific time period.

Compatibility with Java Server Faces
In this release we also added support for Java Server Faces. Our product Reports.Java is fully compatible with Java Server Faces (from the version 2.2).
Break if True in Reports.Java
When using multi-level conditions in a report you can break the processing of report conditions. By default, all the conditions are processed sequentially until the last level. In the release of 2016.2, we added the Break if True option. If this option is enabled and the condition of any level is processed, i.e., returns the true value, then there is a break and other conditions, located below, will not be processed. If the option is disabled, then all levels of the condition are processed sequentially.

Styles for Charts in Reports.Java
Now you can create styles for the charts. This provides an opportunity to significantly increase the attractiveness of your reports with charts and make them look better.

MS SQL Data Source in Reports.Java
Now you can create a MS SQL data source and generate reports based on this source.